The late 1920s market bubble was one of the biggest bubbles U.S. markets ever saw. Yet, not all industries participated in it. A breakdown of how each industry performed over that period tells the tale.
The Cowles Commission started collecting market data in 1932. The data is available online (linked below), stretches from 1871 to 1937, and is broken down by industry.
A chart of the 1929 bubble and burst looks like this:
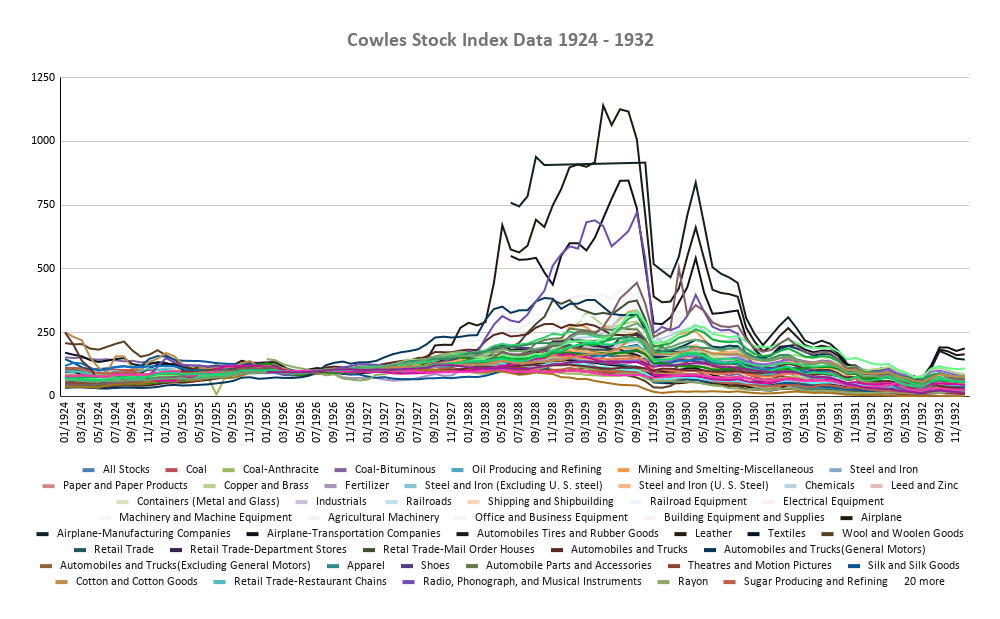
The data is price returns only — no dividends included.
The chart is a hot mess (done so on purpose). It’s also incomplete. For instance, the financial industry, along with investment trusts are missing from the picture. That said, it does show just how few industries were inflated at the time.
To make it easier to see, I broke the industries down by sector, kept the vertical axis uniform, and included the “all stock” index as a comparison. Just for reference, the “all stock” index was up 217% from the beginning of 1924 to the September 1929 peak. It then fell 79% from the peak to the end of 1932.
Let’s start with energy stocks.

There’s not much to see there. The energy stocks underperformed the “all stock” index. Anyone who bought a basket of coal stocks at the start of 1924 was sitting at a loss at the September 1929 peak. By the time 1932 ended, coal stocks were down 91%.
Oil stocks were higher, but even those didn’t start rising until 1928. From the beginning of 1928 to the ’29 peak, oil stocks were up 60%. From the start of 1924 to the end of 1932, every industry had a loss.
Now, let’s look at the Materials stocks.
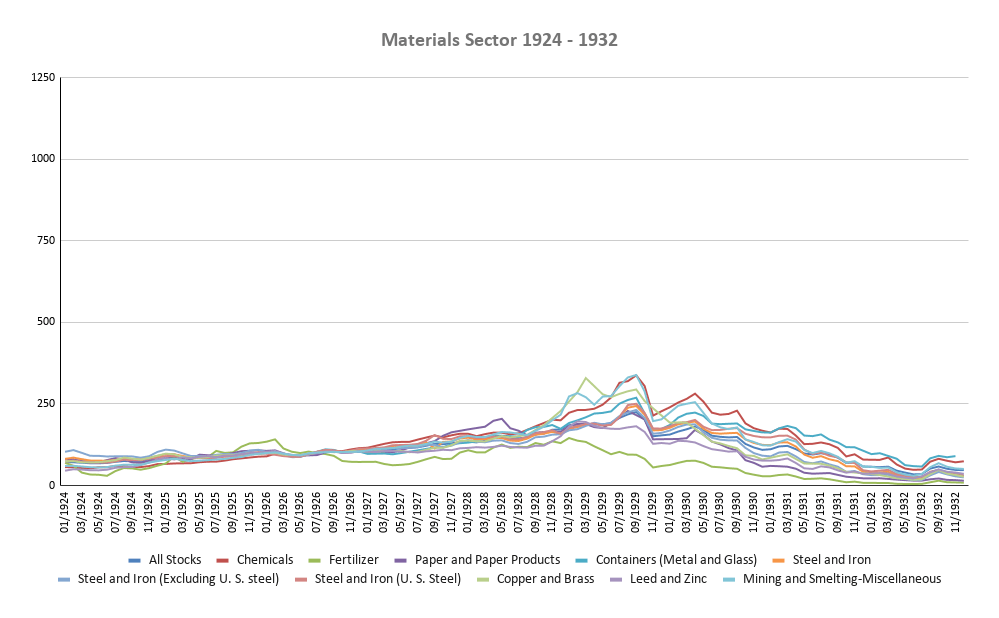
That’s slightly more exciting. Zooming in at the 1929 peak, every industry performed well. Chemicals and Mining/Smelting were up the most, 498% and 464% respectively since the start of 1924. Fertilizers were the worst at 36%. Everything else was up at least 100% from 1924 to the 1929 peak.
More notable: Chemicals were higher at the end of 1932 compared to where it began in 1924. Every other industry sat at a loss — peak to trough losses ranged from -78% to -93%.
Next up are the Industrials stocks.

You’ll notice three industries really stand out. Two popped up out of nowhere in the middle of 1928. All three contributed to the bubble in airplane stocks. From 1924 to the 1929 peak, airplane stocks rose 2,106%. Then they fell 84% to close 1932. Also, check out that rebound to end the year! Had you bought a basket of airplane stocks at the start of 1924, you would have had a 261% return at the end of 1932.
Two other notable industries stand out. Electrical Equipment and Agricultural Equipment were the only other industries with a positive return from 1924 to 1932 — 6% and 18% respectively. Both were up over 600% at the September 1929 peak.
Lastly, peak to trough losses across all industries was horrible again — ranging from -74% to -89%.
Consumer Discretionary is broken into two charts. First up is consumer durables.
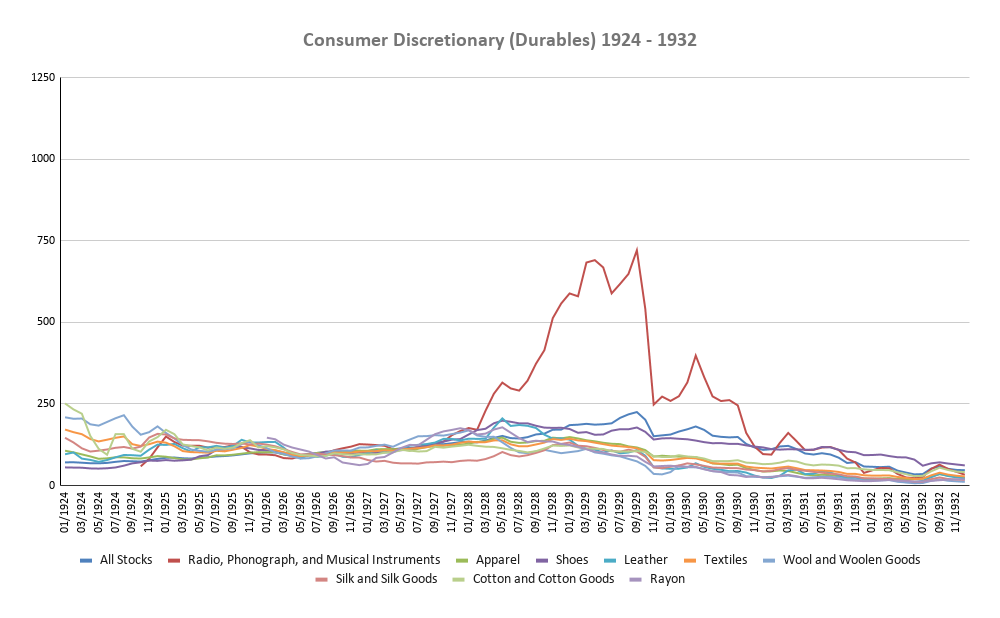
One industry stands out — radio. Its first data point starts in October 1924. At the September 1929 peak, it rose by 1,126%. It then stumbled through some fits and starts to a 95% loss to end 1932.
The shoe industry was the only industry with a positive return — 11% — from 1924 to 1932. And peak to trough losses ranged from -61% to -95%.
Here’s the rest of the Consumer Discretionary stocks.
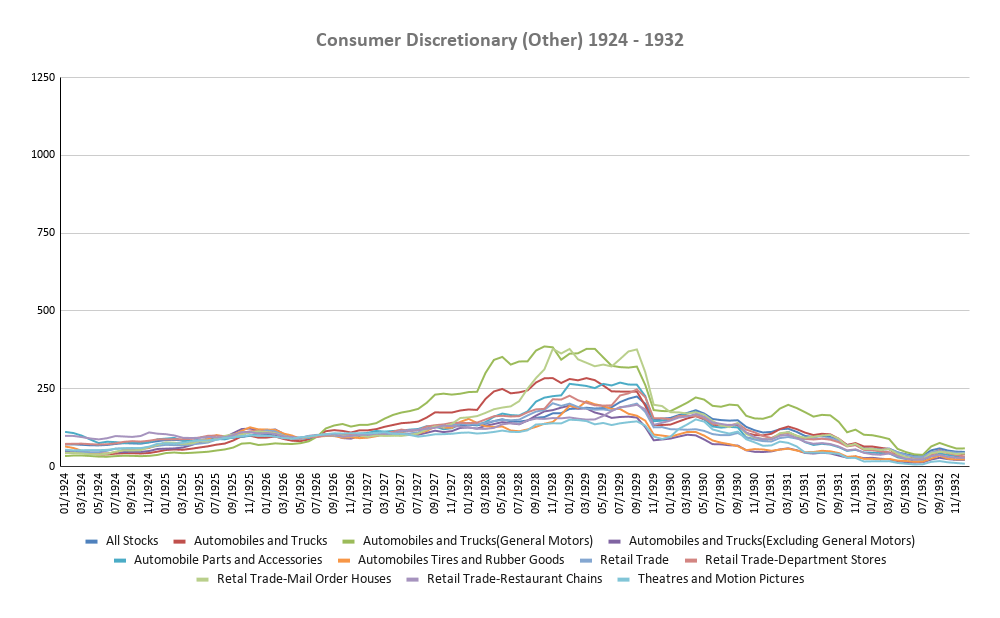
The highlight is automobiles, specifically, General Motors. It saw an 851% gain from 1924 to the 1929 peak. It was also up 73% from 1924 to 1932.
Auto stocks excluding GM only saw a gain of 459% to the peak and a loss of -74% over the entire period. GM was also included in the major market indexes at the time, which contributed to their rise.
Mail order retail — i.e. the Sears and Montgomery Ward catalogs — was the other industry that stood out. It was up 767% from 1924 to the ’29 peak and from 1924 to 1932, it was only down 3%. And once again, every industry saw major losses peak to trough ranging from -79% to -94%.
Next up is Consumer Staples.
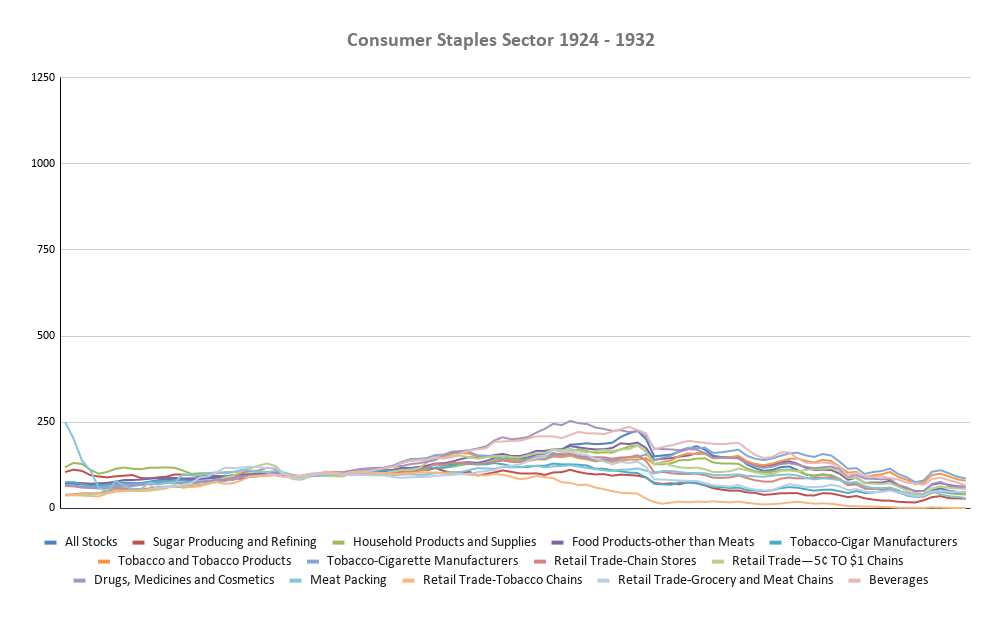
Generally, Consumer Staples are not exciting stocks. They just chug along through good times and bad. That’s mostly the case here too. A few things stand out though.
Sugar producers/refiners sat at a 10% loss from 1924 to September 1929, but the meatpacking industry really suffered — 54% loss over the same period.
On the other hand, tobacco and retail did well over the entire period. Cigarette manufacturers held a 30% gain and the old five and dime chain stores were up 50% from 1924 to 1932. Lastly, the peak to trough losses fell in a wider range of -41% to -97%.
Now for the Utilities.
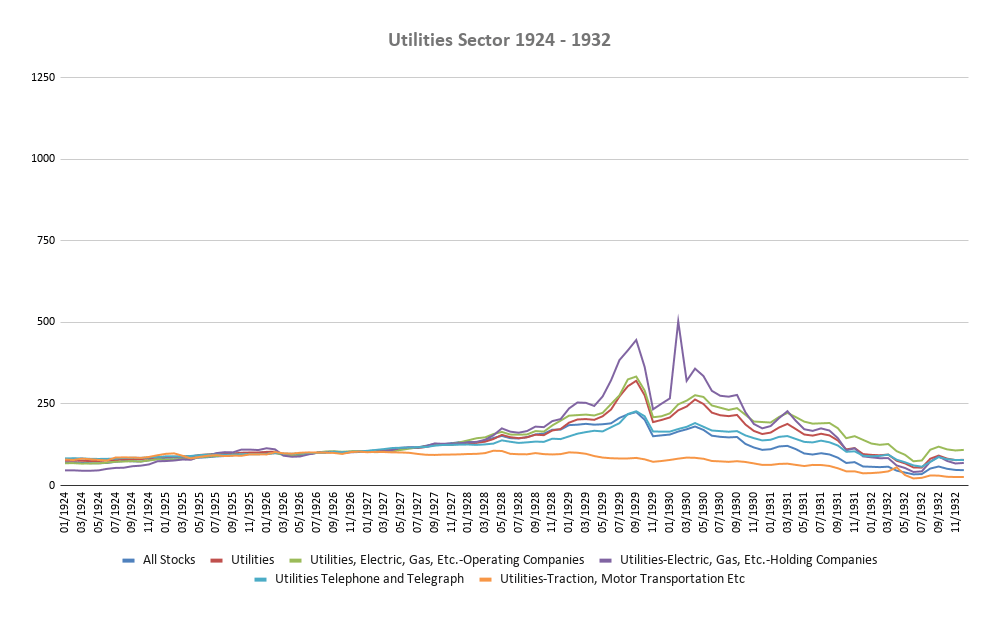
Electric/Gas utilities certainly were caught up in the bubble, but its performance overall was positive. The industry saw peak gains of 855% from 1924 to September 1929 and more than recovered after the ’29 crash. Over the entire period, it was up 48%. Again, peak to trough drawdowns for all industries ranged from -66% to -84%.
Finally, here are the last few industries that didn’t quite fit.
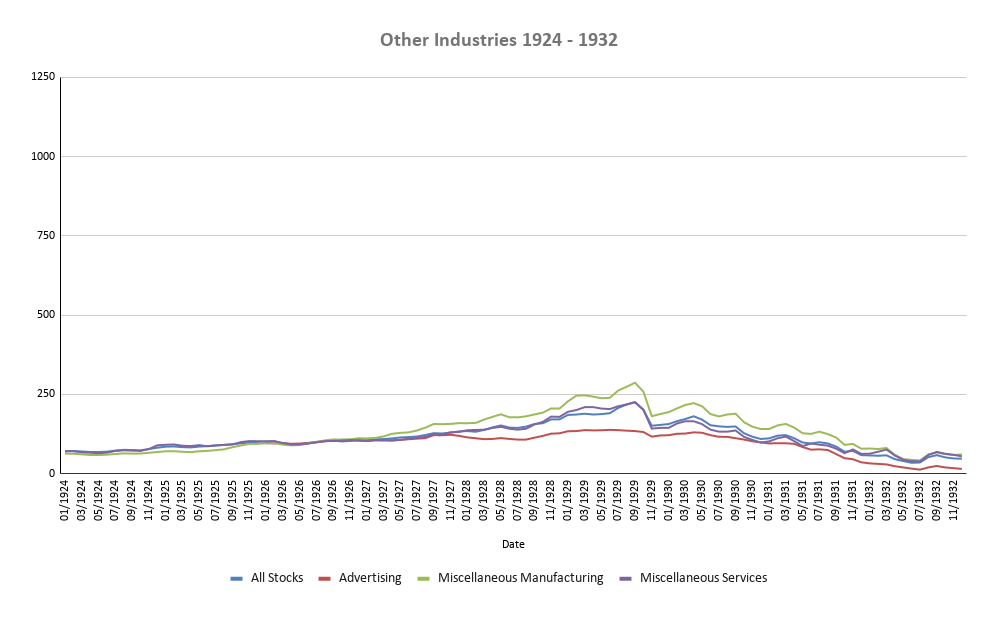
There’s not much to add really. Advertising industry stocks didn’t show up until 1926 and were only up 40% in 1929. All three industries experienced big losses from peak to trough — ranging from -76% to -89%.
To wrap it up. More often than not, market bubbles are due to the excitement around some new innovation. The fact that the companies behind it have no history to be dragged down by and a wide-open future make them more enticing. It certainly allows for a cleaner story behind them too.
The late 1920s bubble was unique. First, it didn’t take off until 1928. Second, three innovations — the automobile, airplane, and radio industries — dominated the bubble. All three were transformative on their own. And when the market crashed in 1929, those three industries were hit the hardest. But the 1929 crash didn’t entirely kill the excitement in those industries. Each one experienced a second spike in 1930 before the real meltdown began. It wasn’t until late 1932 that the innovation around airplanes got its second wind.
Lastly, a new financial innovation was introduced for the first time. The investment trusts fed the high demand for shares but also contributed to it, pushing stock prices higher.
Obviously, other industries were caught up in the euphoria but not nearly on the same level. For the most part, they recovered after the 1929 Crash too. It wasn’t until the country slid into a Depression that every industry got clobbered.
Source:
Cowles Common Stock Index Data 1871 – 1937
Last Call
- The Big Lessons From History – M. Housel
- Companies Whose Board Members are Also Major Shareholders Typically Outperform – L. Cunningham
- The Sharpe Ratio Broke Investors’ Brains – Institutional Investors
- Horses for Courses – Verdad
- Don’t Take the CEO Job at a Successful Company – Klement on Investing
- Unraveling Value’s Decade-Long Underperformance (and Imminent Resurgence) – LT3000
- Value Investing Live: 8 Legendary Investors Introduce You to Their Craft in Their Own Words (video) – Wiley
- Learning From Cornelius Vanderbilt – Investment Master Class
- The Intriguing Maps that Reveal Alternate Histories – BBC