A year ago this month, the market experienced one of the fastest crashes ever. It was followed by one of the fastest recoveries but the recovery wasn’t uniform.
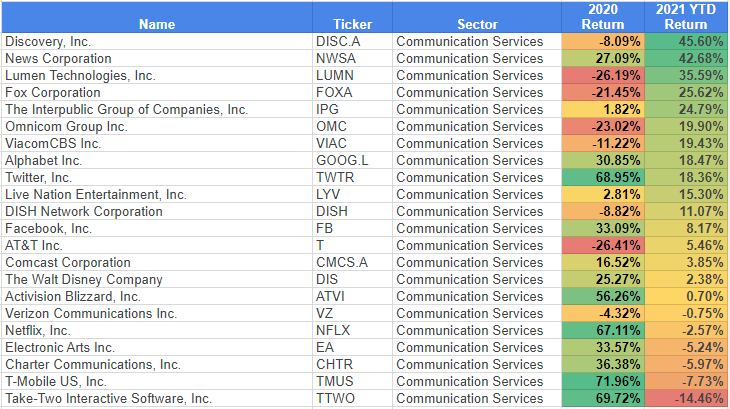
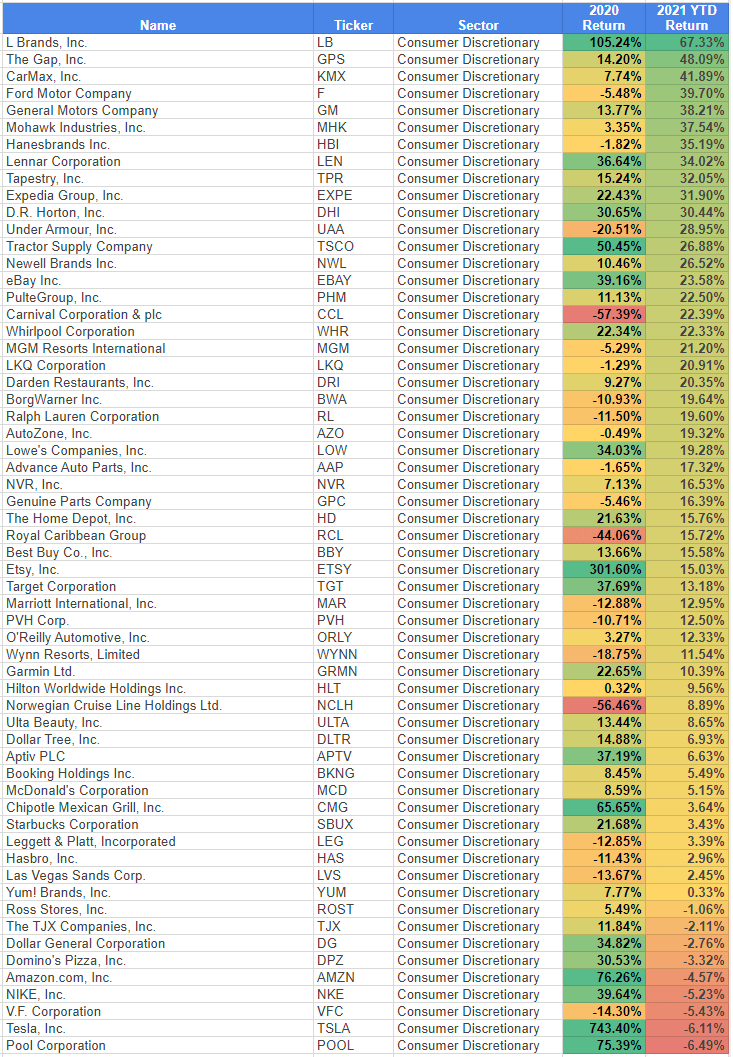
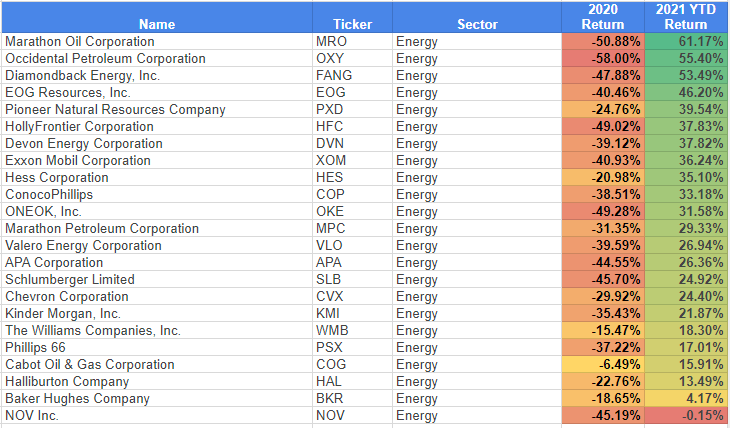
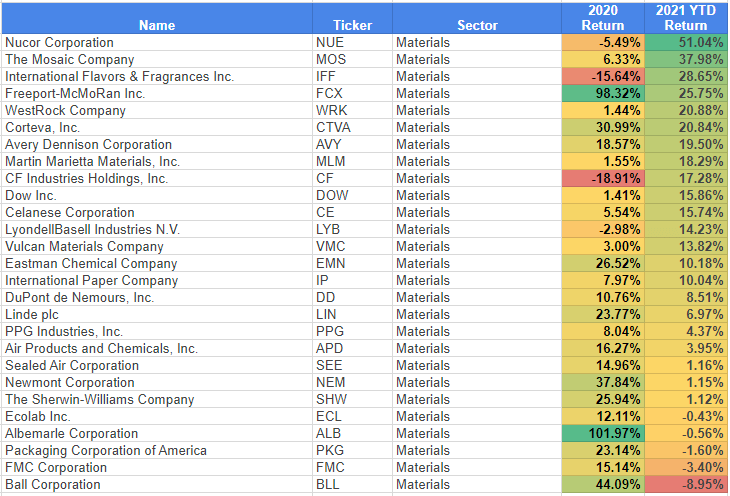
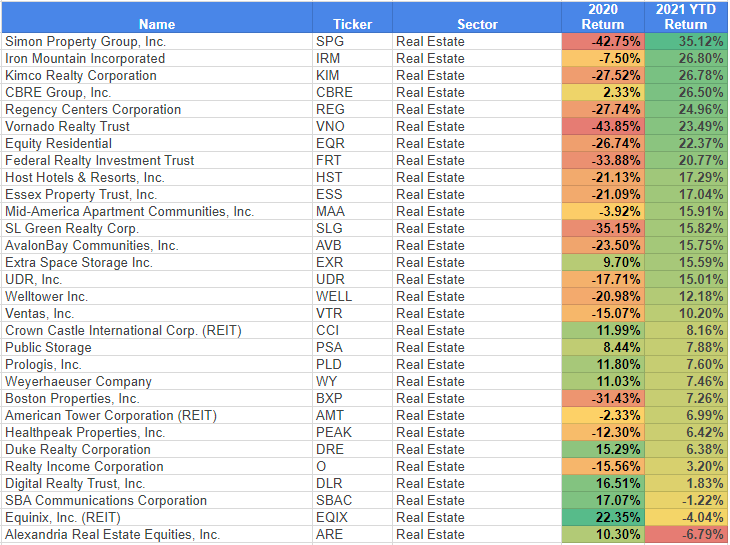
2020 saw technology, consumer discretionary, communication services, and materials sectors as the biggest winners. Financials, real estate, and energy struggled.
That appears to have changed…so far. That should come as no surprise either. With markets, old trends die. New trends are formed. Last year’s winners can become this year’s losers. The death of value can be resurrected.
The only certainty with markets is change. Investors expecting things to stay the same are sure to be disappointed.
A couple of quick points before diving into the results:
- It’s important to not make any rash assumptions based on 3 months of data. It tells us nothing about how the rest of the year might play out. If anything, the Q1 data shows just how widely a company’s stock price can move in a matter of months.
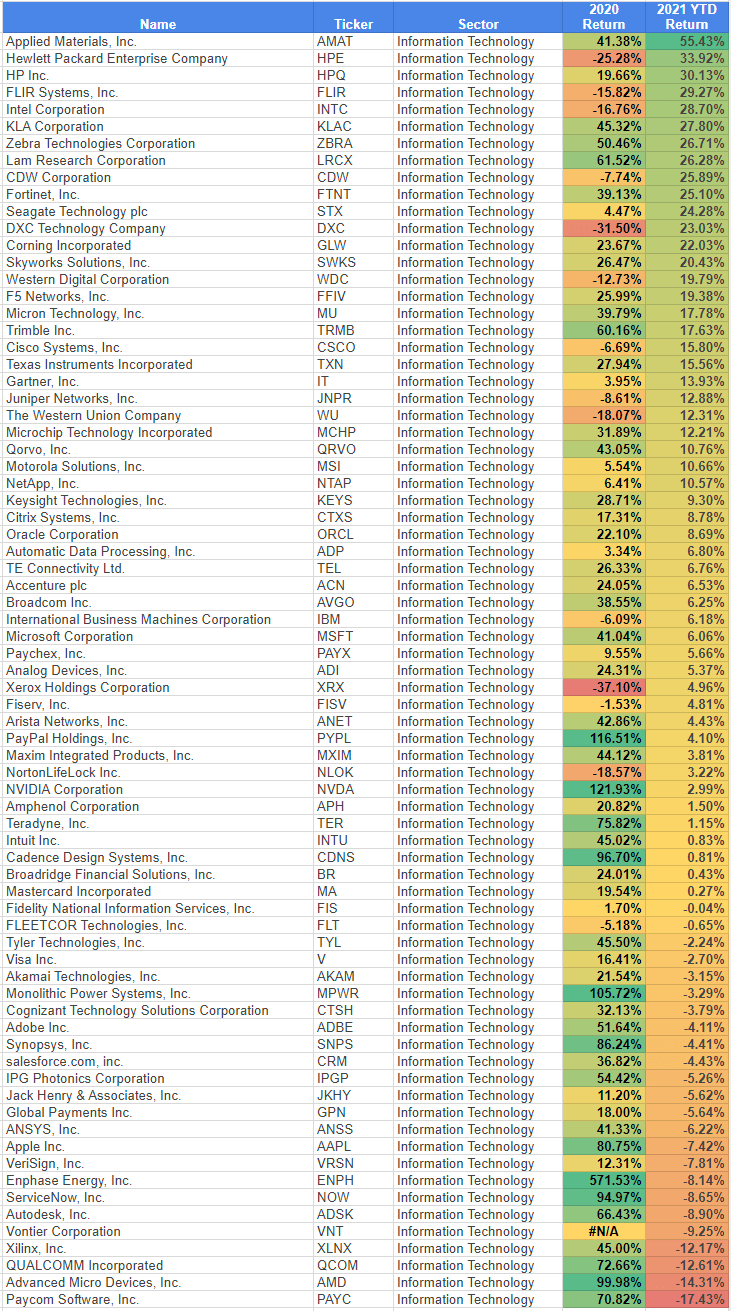
- If sector funds pique your interest, keep in mind that some sectors are more diverse than others. For instance, the communications sector only contains 22 stocks — the lowest number. Energy is next with 23. Technology is the most diverse with 75 stocks.
- Also, check out which companies fall into which categories. You might be surprised how a few companies are sorted. Just another thing to keep in mind if you’re into looking at sector funds.
Now for some actual data:
- The S&P 500 is up 6.2% YTD (as of midday today. I wasn’t waiting for the closing bell.)
- Roughly 20% of the S&P 500 stocks sit at a loss YTD, with a median return of -4.42%.
- Technology and Consumer Discretionary sectors, the best performers last year, are some of the worst YTD — 0.2% and 2.1% respectively.
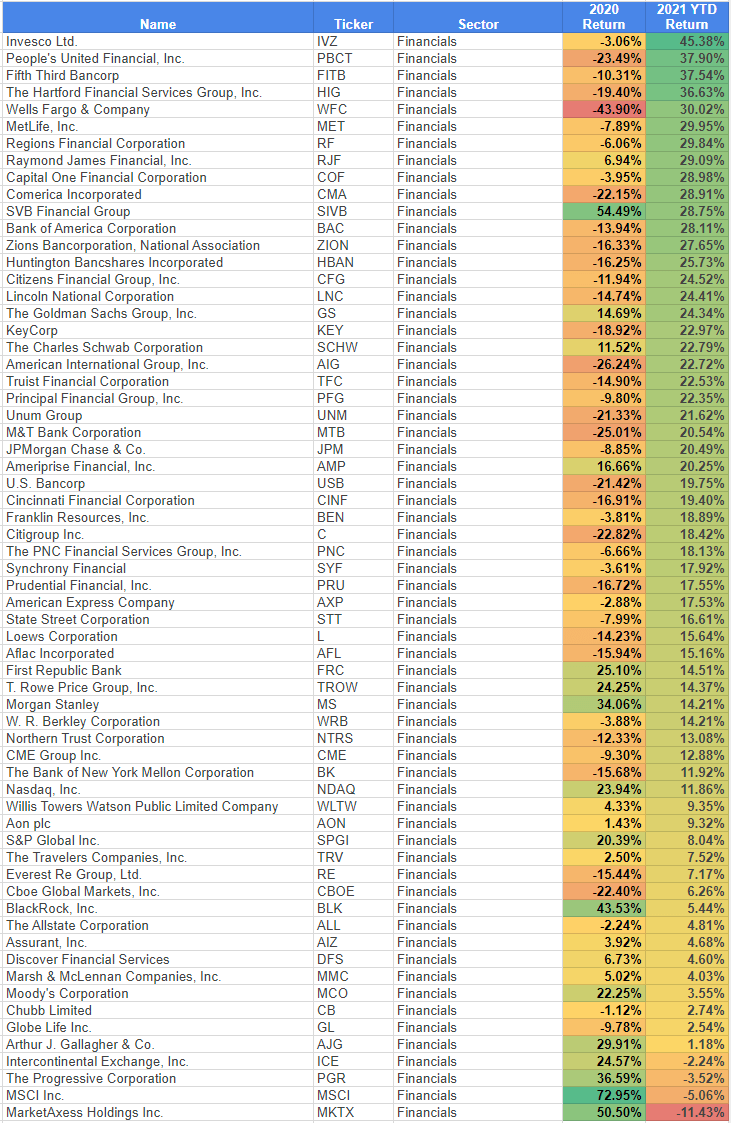
- The biggest winners YTD? The Energy and Financial sector, two of last year’s worst performers, are the best performers YTD — 30% and 16% respectively.
- The S&P 500’s 100 best-performing stocks in 2020 had a median return of 45.5%. Those same stocks have a median return of 0.8% YTD. Exactly half are trading at a loss.
- The S&P 500’s 100 worst-performing stocks in 2020 had a median return of -23.1%. Those same stocks have a median return of 20.8% YTD. Only three are trading at a loss.
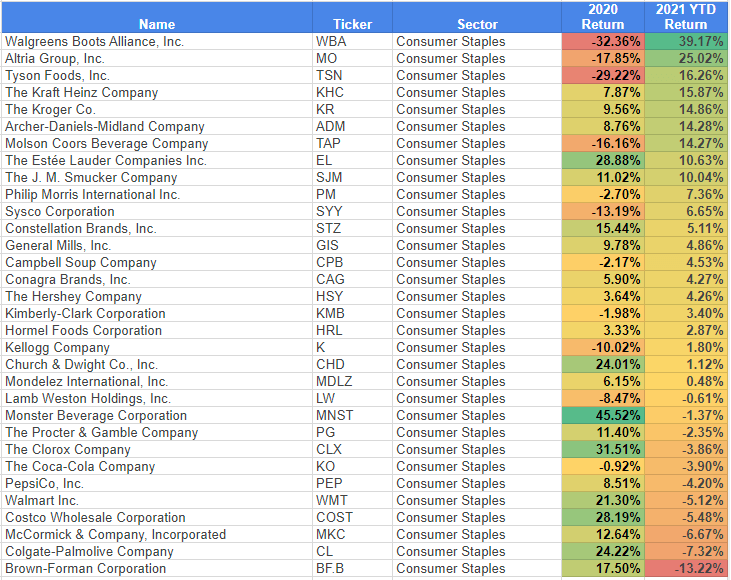
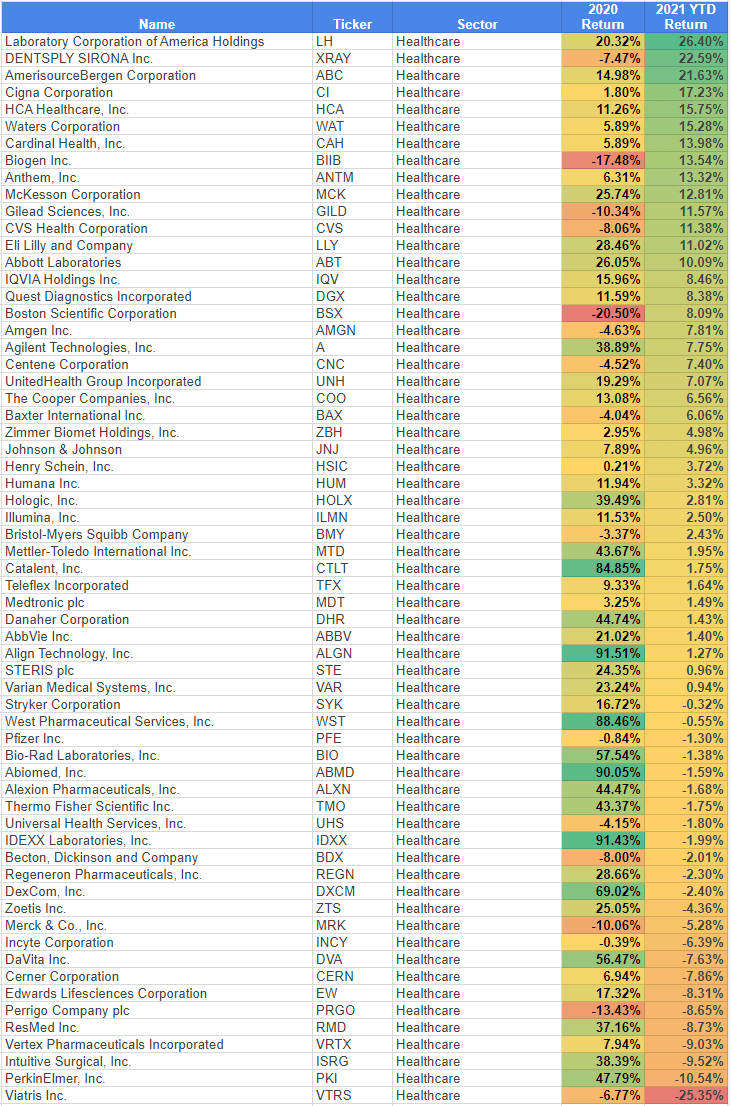
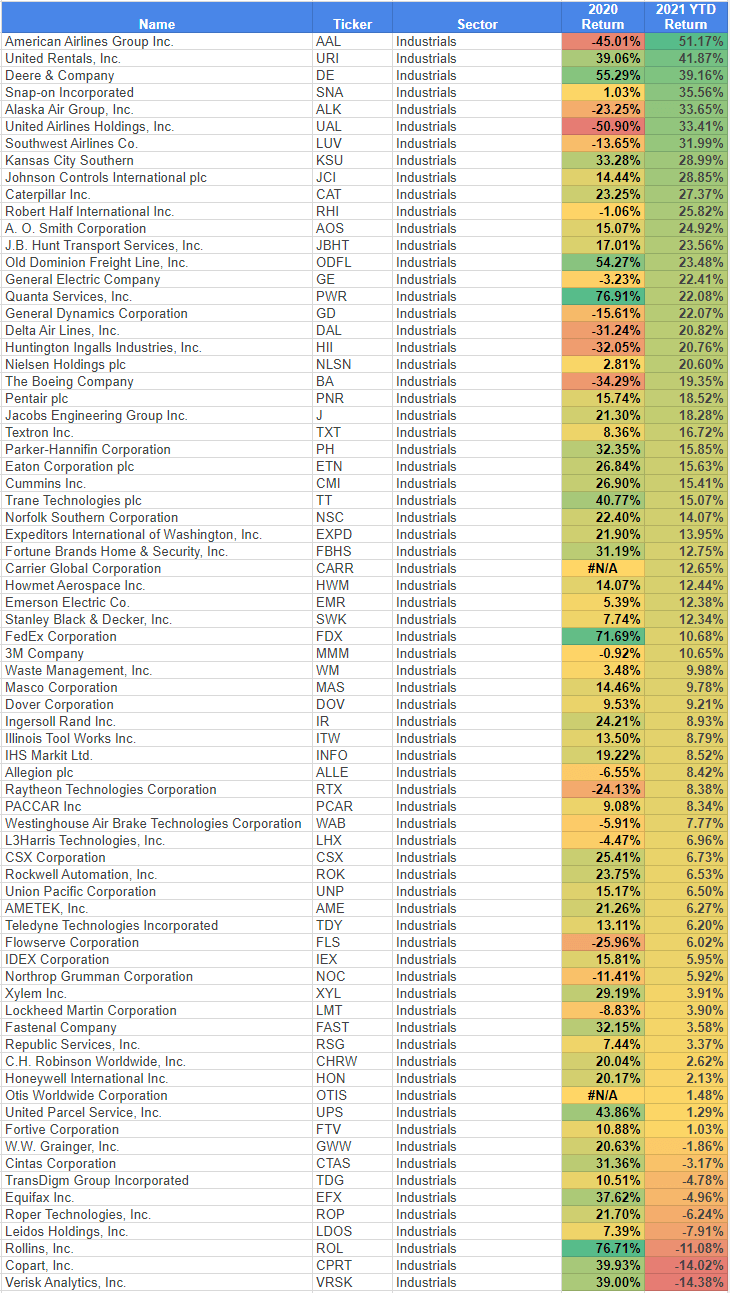
Below, you’ll find tables broken down by sector. The returns are price returns only (the YTD returns are based on the price of the stock about midday 3/31/2021).

Related Reading:
2020: A Year in Returns
2020: First Half Returns