
Broader markets in Q3 appeared almost stagnant. On the surface not much happened.
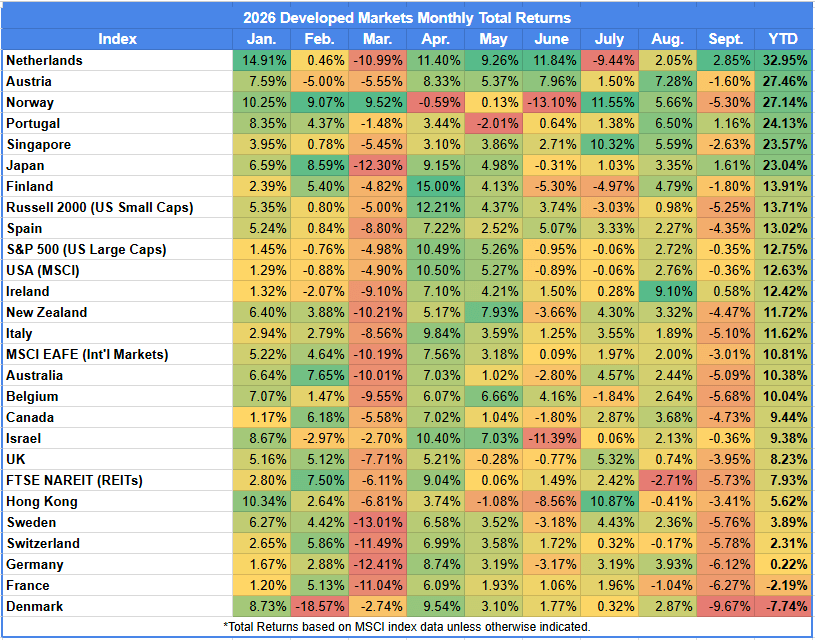
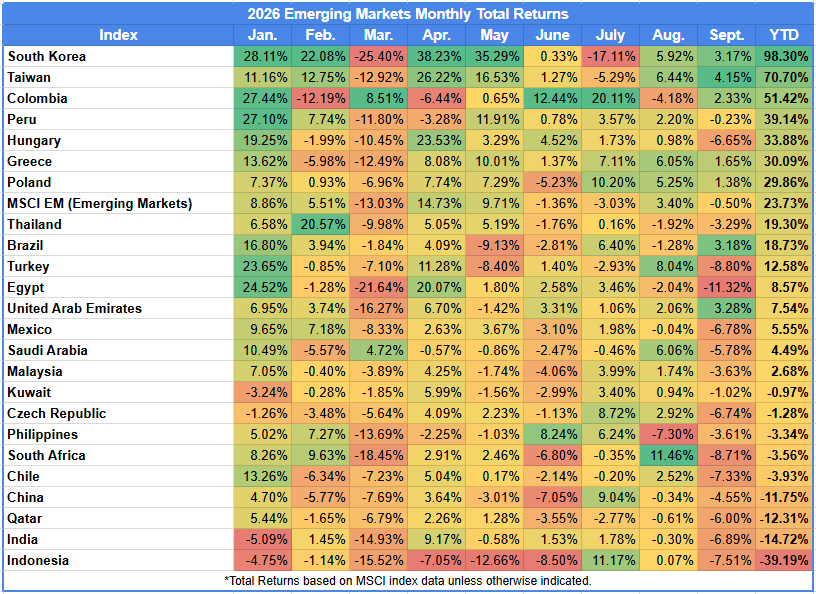
The S&P 500 gained 2.3% in the third quarter. The MSCI International markets index (EAFE) gained 0.9%. The MSCI emerging markets index fell 0.2%.
As is usually the case, what goes on under the surface is anything but calm. The chaos from competing narratives in markets sometimes gets cancelled out in broader index performance. Yet the AI/tech, war, and interest rate stories in Q3 were still felt.
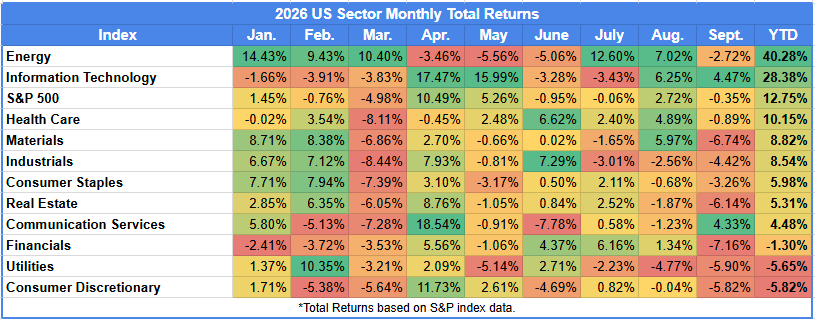
US small caps declined 7.2% in the third quarter. REITs fell 6%. Seven of the eleven US sectors were lower in Q3. Utilities were the worst at -12.4%.
Yet the healthcare sector was up 6.6%. Tech was higher by 7.2%. Energy, the best performer in Q3, was up 17.2%.
It’s safe to say that rising interest rates hit the more interest sensitive stocks like REITs and Utilities. Supply issues from the war showed in Energy stocks. While interest rates affect company valuations, so does future growth. The continued growth story in tech, seems to be winning the narrative game, so far.
It will be interest to see how higher interest rates affect markets and investors’ decisions going forward. For one, rising interest rates create options for investors. Higher rates make bonds more competitive with stocks. Treasuries look more attractive paying over 5% and offer more certainty of income that you won’t get with stocks.
If inflation can be reined in, weighing the tradeoff between stocks and bonds may be a more interesting allocation decision for your portfolio.
A note before the quarter’s highlights: The asset class, sector, international, and emerging market returns are up to date through June 30, 2026. Hit the links for each.
Four tables are below. The US sector, developed markets, and emerging markets performance is broken down by month. The final table shows quarterly returns on the year for all three.
A few highlights stand out:
- Energy and Tech are the big performers year to date at 40.8% and 28.4% respectively. No other sector comes close.
- Energy, Tech, Healthcare, and Communications are the only sectors higher in Q3.
- Industrials and Utilities dropped the most from Q2 to Q3. They were the only sectors with losses in July, August, and September.
- The S&P 500 has a 12.75% total return through Q3. It was the best performing broad index in Q3 at 2.3%.
- It’s safe to say that Tech is driving the S&P 500 year to date. The Energy sector’s performance has helped but it makes up less than 4% of the index. Healthcare is about 9% of the index. Communications is about 10%. Tech, at about 40%, has the biggest impact on the S&P 500’s performance going forward.
- The Tech sector has a slightly higher weighting in the S&P 500 than Real Estate, Materials, Utilities, Energy, Consumer Staples, Industrials, and Consumer Discretionary combined (by weighting lowest to highest). Communications and Financials make up about 21% of the index.
- Despite small caps falling 7% from Q2 to Q3, it’s the best performing US-based asset class through three quarters.
- Emerging markets led all equity asset classes through Q3. Yet it was almost unchanged from Q2 (down slightly from 24.0% to 23.7%).
- The 3 largest stocks in MSCI’s Emerging Markets index are still semiconductor stocks with a weighting of 29.1% at the end September. That’s down slightly from 31% at the end of June.
- South Korea and Taiwan, in that order, are the best performing country indexes to date. Both led also in Q2, largely due to performance in semiconductor stocks.
- Two semiconductor stocks make up 63% of the South Korea index. One semiconductor stock makes up 58% of the Taiwan index.
- Indonesia is the worst performing country year to date. It broke its consecutive monthly losing streak – at 7 months — with an 11% gain in July. A 7.5% loss in Septembers dropped it almost to where it was at the end of June.

Related Reading: