 Would it surprise you that the S&P 500 historical returns tell an eerily similar story to the history of international stock returns. Despite it, people still see the market as a casino or they complicate it with some overly elaborate strategy.
The S&P is the standard benchmark for large cap performance. It’s also an index you can own via ETF or index fund. While the experts argue whether now is a great time to buy the S&P, history tells you a better story.
The S&P 500 has been around in some form since 1926. That gives us 88 years of annual returns to dig through. Since large cap stocks make up a big part of most allocations, this should give you an idea of what to expect from that piece of your portfolio.
The tables below represent the S&P 500 performance, including dividends, over the 88 year period from 1926 to 2013.
Breakdown of S&P 500 Annual Returns
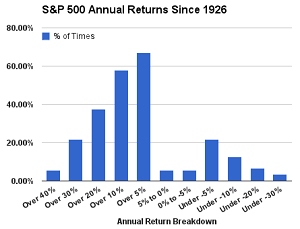
If the market really is a casino, what are you’re chances of picking any year and coming out ahead? The table below breaks down the S&P 500 annual returns since 1926.
| Annual Return Breakdown | # of Times | % of the Time |
| Over 40% | 5 | 6% |
| Over 30% | 19 | 22% |
| Over 20% | 33 | 38% |
| Over 10% | 51 | 58% |
| Over 5% | 59 | 67% |
| 5% to 0% | 5 | 6% |
| 0% to -5% | 5 | 6% |
| Under -5% | 19 | 22% |
| Under -10% | 11 | 13% |
| Under -20% | 6 | 7% |
| Under -30% | 3 | 3% |
Let’s debunk the casino metaphor now. Had you randomly picked a year to gamble on the S&P 500, you’d have a lot of possible outcomes. Even so, luck is in your favor. The S&P 500 ended the year positive 73% of the time. Yes, it’s hard to pick the great years, but casinos still won’t take those odds.
5 Year Returns
Now that we’re not gambling, what if you stayed invested for five straight years? There were 84 five-year periods from 1926 to 2013. The table below breaks down the annual returns for each period.
| 5 Year Return Breakdown | # of Times | % of the Time |
| Over 30% | 0 | 0% |
| Over 20% | 9 | 11% |
| Over 10% | 47 | 56% |
| Over 5% | 58 | 69% |
| 5% to 0% | 14 | 17% |
| 0% to -5% | 7 | 8% |
| Under -5% | 5 | 6% |
| Under -10% | 2 | 2% |
| Under -20% | 0 | 0% |
When you stick around for five years, the range of returns smooth out over time. You’d miss out on big losses (no -20% periods) and bigger gains (no 30% periods). The possibility of making money is higher – the S&P ended higher 86% of the time.
10 Year Returns
How about a long-term strategy? What could you expect if you held on for 10 years? The S&P had 79 rolling ten-year periods from 1926 to 2013. The table below breaks down the annual returns for each period.
| 10 Year Return Breakdown | # of Times | % of the Time |
| Over 30% | 0 | 0% |
| Over 20% | 1 | 1% |
| Over 10% | 38 | 48% |
| Over 5% | 65 | 84% |
| 5% to 0% | 9 | 11% |
| 0% to -5% | 4 | 5% |
| Under -5% | 0 | 0% |
Stay invested for 10 years and you hit 95%. No, it’s not perfect. That won’t happen until you reach 15 years.
The story of the S&P 500 is one that has been told many times before. Your chance of success increases with time. And if doing nothing gets near perfect results, how much effort does it take to lose money? Seriously, losing money in the stock market is hard work and it only gets harder the longer you stay in.
Overall Notes:
- In the 88 year span, the S&P 500 produced a 10.08% annual return (including dividends).
- The one year high was a 53.99% gain in 1933, the low was a -43.34% loss in 1931.
- Of the 19 years that had 30+% gains, like 2014, only 7 were followed by a loss while 9 were followed by double-digit gains.
- Only 24 of the 88 years ended in a loss or 27% of the time.
- Consecutive losing years don’t happen too often – only six times in S&P 500 history – as shown in the table below.
- The 5 year high was a 28.56% annual return ending in 1999, the low was a -12.47% annual return ending in 1932.
- The 10 year high was a 20.06% annual return ending in 1958, the low was a -1.38% annual return ending in 2008.
- Of the four losing 10 year periods, the two most recent ended in 2008 and 2009. Before that, the other two losing 10 year periods ended in 1938 and 1939 – the Great Depression.
- Chasing losing years, produced an average annual gain of 12.52% over the five years following a loss, as you see from the table below. Like all strategies, it doesn’t work all the time. Of the 24 losing years, only 15 outperformed over the next five years.
The table below shows the 5 year annual return of the S&P 500 following a losing year.
| Year | Return | Next 5 Years (annual) |
| 1929 | -8.42% | -9.93% |
| 1930 | -24.9% | 3.12% |
| 1931 | -43.34% | 22.47% |
| 1932 | -8.19% | 14.29% |
| 1934 | -1.44% | 10.90% |
| 1937 | -35.02% | 4.62% |
| 1939 | -0.41% | 7.67% |
| 1940 | -9.78% | 16.96% |
| 1941 | -11.59% | 17.88% |
| 1946 | -8.07% | 16.69% |
| 1953 | -0.99% | 22.30% |
| 1957 | -10.78% | 13.31% |
| 1962 | -8.73% | 12.39% |
| 1966 | -10.06% | 8.42% |
| 1969 | -8.50% | -2.35% |
| 1973 | -14.66% | 4.32% |
| 1974 | -26.47% | 14.76% |
| 1977 | -7.18% | 14.07% |
| 1981 | -4.19% | 19.87% |
| 1990 | -3.10% | 16.59% |
| 2000 | -9.10% | 0.54% |
| 2001 | -11.89% | 6.19% |
| 2002 | -22.10% | 12.83% |
| 2008 | -37.00% | 17.94% |
Rather than chasing losing years, you should be chasing periods of underperformance, as you’ll see in the chart below. Since most of us aren’t willing to wait a decade, the next best thing is to take advantage of losing years to recapture those gains in the future. You can do this simply by rebalancing.
This is nothing new. The best way to outperform is to take advantage of a sale. Buy the market after prices are marked down. This is why Buffett and other great value investors outperform the market. They exploit the “sale” years, patiently waiting for stocks to reprice higher while never getting greedy once it happens.

Extended periods that outperform follow periods that underperform, then the cycle renews. It’s easier to recognize underperformance then to guess when the outperformance ends. And you’re timing doesn’t need to be perfect. The question is whether you have the patience to do nothing and wait.