The only constant in markets is change. Take the 1950s.
The first detailed study the stock market was done in 1952 on shareholder demographics in the U.S. The book is 140 pages of tables and charts breaking down businesses and share ownership in the U.S. (someone shared a link to it earlier this week, don’t remember who).
The most obvious thing that stands out is the huge difference in the sector/ industry breakdown in 1952 compared to today.

Manufacturing was the largest sector by total market cap at the time, followed by oil/refining (energy), and third was utilities. Almost half of the shareholders held at least one manufacturing company. And the breakdown looks nothing like today.
“Manufacturing” is a mix of what would today be industrial, consumer staples, and discretionary. Today, utilities make up about 3% of the total market cap. You’ll also notice no technology or healthcare sector. Innovation, disruption, and destruction have had the biggest impact on sector and industry changes over the last 70 years (and the next 70 years).
A few other tables stood out too.
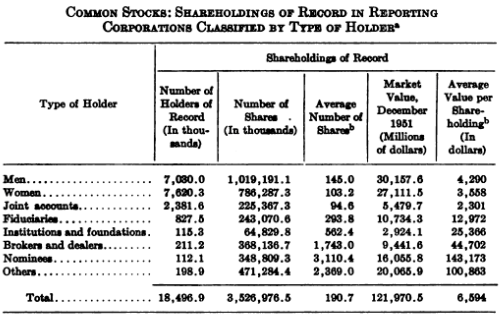
The first table above shows the distribution by type of shareholder on record for those companies that reported information. It accounts for roughly 25% of the total shares issued in the U.S.
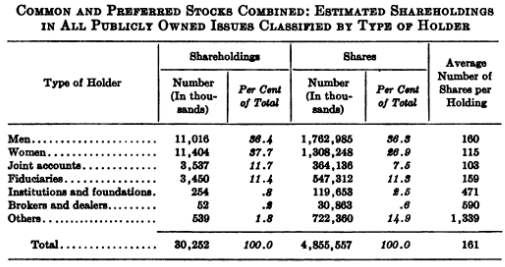
The second table shows the estimated ownership for all publicly owned corporate shares (common and preferred). Also, it’s a measure of shareholdings: “Each holding by an individual or other owner counts as one shareholding; a person who owns shares in five stock issues has five shareholdings.”
First, men might have owned more total shares, but more women participated as shareholders. This was partly due to AT&T. More women owned AT&T stock than men. That stat alone explains half of the difference for more female stockholders.
Second, the largest stakeholder in common stocks were individuals. That has since changed by a lot.
In 1952, it was estimated that 6.5 million individuals owned one or more stock issues. For reference, the U.S. population in 1951 was about 155 million. So even though households made up the largest owner of total shares, a fraction of the total population owned shares. About one out of every 16 people owned one or stock issues.
Now compare that to 1956 and 1959, which I found by accident.
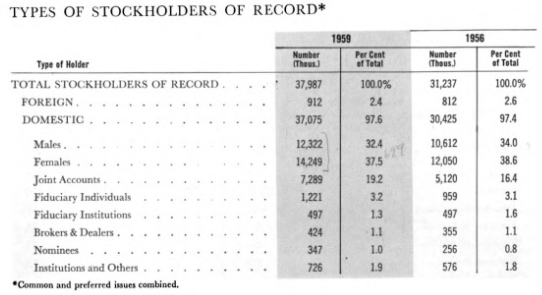
The divide between female and male ownership grew. The overall ownership percentages didn’t change much. But the number of individual market participants grew. It doubled since 1952 (and 45% higher than 1956). About 12.5 million individuals owned one or more share issues in 1959 or one out of every eight people owned at least one stock issue. Here are a few more stats:
- Median age of new shareowners (since 1956) is 35, compared to 49 for all shareowners.
- The average shareowner has a median household income of $7,000; comparable figure for new shareowners is $6,900.
- One out of five shareowners first acquired stock through an employee stock purchase plan, about 50% bought through a broker.
- Holders of shares in investment companies only number 1,235,000 — four times the 1956 total.
What sticks out is that the 1950s were a phenomenal decade for stocks. The Dow kicked off 1950 at 200 points and closed 1959 at 679. With dividends included, that’s about a 19% annual return for the decade. That performance will get people’s attention.
It’s exactly what was needed after the long drought of stock hatred during the 1930s and 40s. It revived the love part of the love/hate relationship investors have with the stock market.
It’s also a perfect example of return chasing. As is often the case, most of the investing population show up late to the party.
It’s great that more people are willing to invest their savings. But new investors, who have never experienced a bad decade, soon realize that 19% returns are the exception, not the norm.
Source:
Share Ownership in the United States 1952
Share Ownership in America: 1959 (pdf)
Last Call
- Yuval Noah Harari on What 2050 has in Store for Humankind – Wired
- What Trait Psychology Tells Us about Factor Investing – Market Fox
- What Does the Longest Bull Market Mean? – Bloomberg
- The Yield of an Empire – Medium
- People vs Companies – M. Housel
- Paul Singer, Doomsday Investor – New Yorker
- Why Everyone Should Watch Less News – R. Holiday
- How to Be a Person Who Can Make a Damn Decision – MEL
- How an International Hacker Network Turned Stolen Press Releases into $100 Million – Verge
- The Great Chinese Art Heist – GQ
- What Would It Take to Build a Tower as High as Outer Space? – Aeon