A bear market in everything best describes 2022. Stocks, bonds, real estate, used cars, crypto, sentiment, fraudsters…everything is going down this year.
Of the major market indexes, the Dow and S&P 500 each fell more than 20% before recovering to a 5% loss and 14% loss respectively. The Nasdaq faired worse, dropping more than 30% before recovering to its current 26% loss year to date.

The losses should be no surprise by now. The carnage in Nasdaq stocks, especially, has been covered extensively. Excessive hope and a great story can do wonders for stock prices but eventually, companies need to deliver. Many have not.
A sector breakdown offers a better perspective of which areas of the market have been hit the worst.

Energy stocks have been the lone bright spot in an underwhelming year. Consumer staples and utilities are even on the year. Boring companies, that just chug along, tend to do well in declining markets.
The tech, communication services, consumer discretionary, and real estate sectors weighed the S&P 500 down the most. Of those, communication services faired the worst, dropping to more than 40% at the start of November. In fact, 7 of the 10 largest companies in the sector — Facebook, Alphabet, Netflix, Charter, Comcast, Disney, and Verizon — are down 30% or more this year.
Of course, the sectors only account for the 500 largest stocks in the S&P 500. They ignore thousands of stocks outside it. The next two charts offer a better glimpse of how beaten down the universe of publicly traded stocks has been.
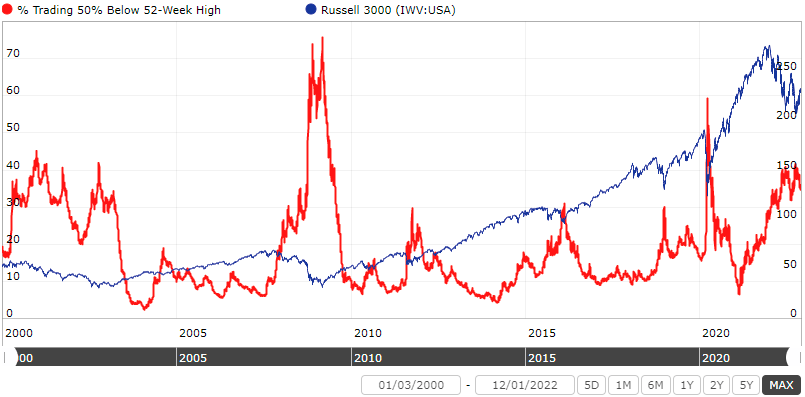
About 34% of all publicly traded (non-OTC) stocks are currently down 50% or more from their 52-week high. That’s around the same level as the Dotcom crash. Only the 2020 pandemic crash and 2008 financial crisis were worse.
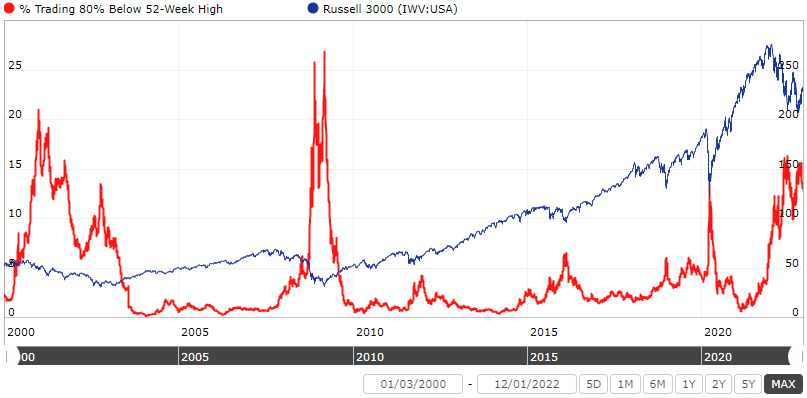
The amount of excess in the markets over the past two years is apparent in the chart above. Currently, 13% of all publicly traded stocks are down 80% or more from their 52-week highs. About half of those are down 90% or more. Again, only the Dotcom crash compares. The financial crisis faired worse, but it had more to do with the entire financial system being at risk of collapse.
What really matters is not what markets have done, but what they might do going forward. Valuation multiples have fallen over the course of the year.
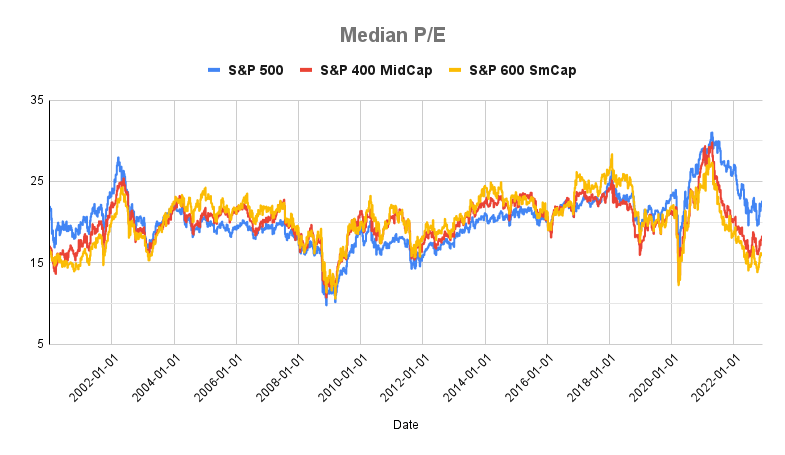
The average P/E for the S&P 600, S&P 400, and S&P 500, tracking small, mid, and large-cap stocks, are down significantly since their peak in April of last year.
The S&P 500’s average P/E fell from a high of 31 to 22 today. Small and mid-caps dropped even further. The average PE for the S&P 400 was cut in half, dropping from 30 to 16. The S&P 600 fell from 27 to 15.
Price/Sales multiples saw similar declines.
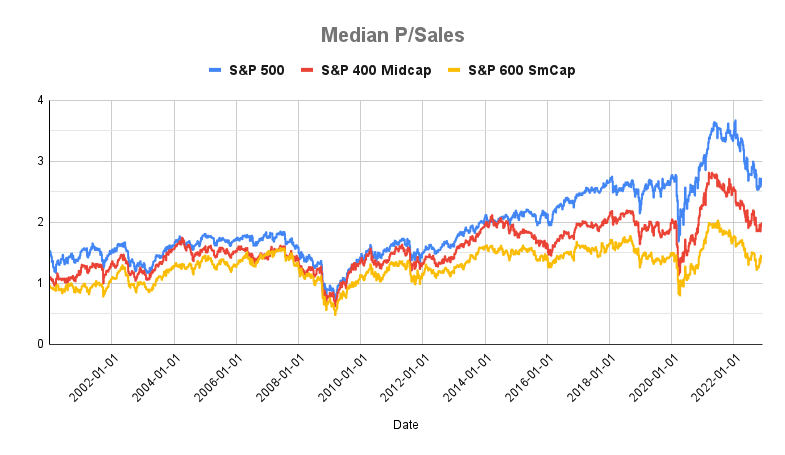
All three indexes hit highs in the middle of last year, with the average S&P 500 stock trading at 3.5x sales. The decline since then can be seen in all three indexes, with small caps being the cheapest.
The pattern, while not as extreme, is found for the average P/FCF.
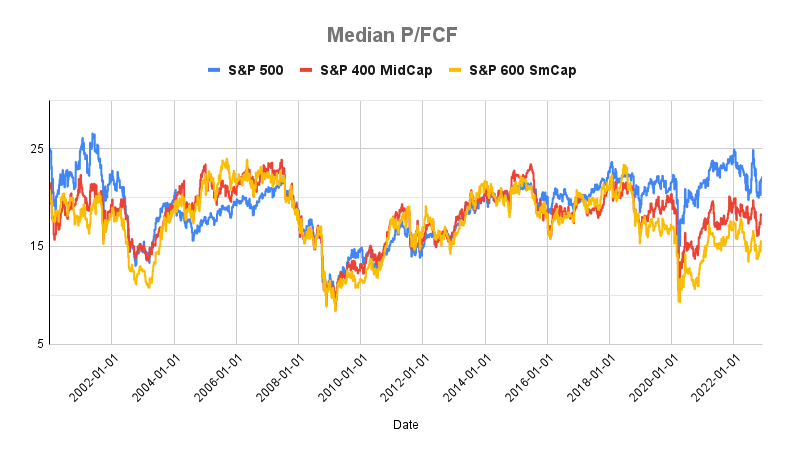
Again, the average valuation for all three indexes have fallen since the beginning of the year. Stock multiples, in general, are lower across the board.
So what’s pushing multiples lower? Take the median P/E ratio. Math states that there are only two ways a ratio can get smaller. Either the numerator (P) decreases and/or the denominator (E) increases.

Earnings per share have been surprisingly flat this year for the S&P 500. That certainly doesn’t fit the pessimism surrounding the economy. Not yet, anyway. It’s safe to say the P in P/E — falling stock prices — is the reason for a lower multiple in the largest companies.
Midcaps tell a different story.
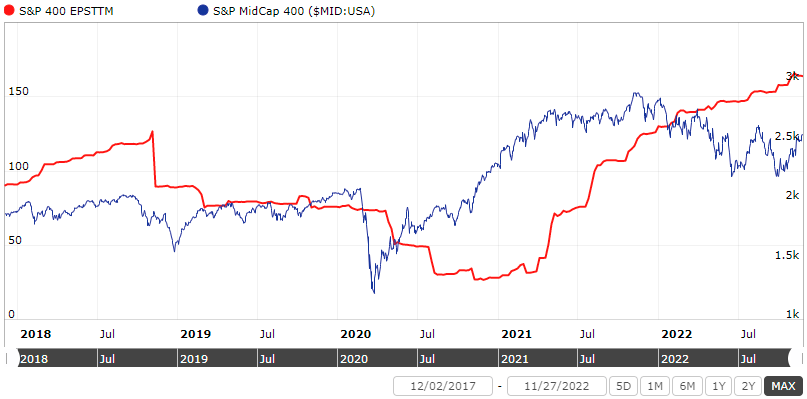
The earnings per share for the S&P 400 (midcaps) has risen throughout the year. The S&P 600 (small caps) follows a similar pattern. Since the S&P 400 is down about 10% year to date (S&P 600 is down about 11% YTD), it’s safe to assume both the P and E are working in concert. Rising earnings, combined with falling prices explain the larger drop in the average P/E multiple for small and midcap indexes.
One of several reasons for lower stock prices is the change in interest rates.
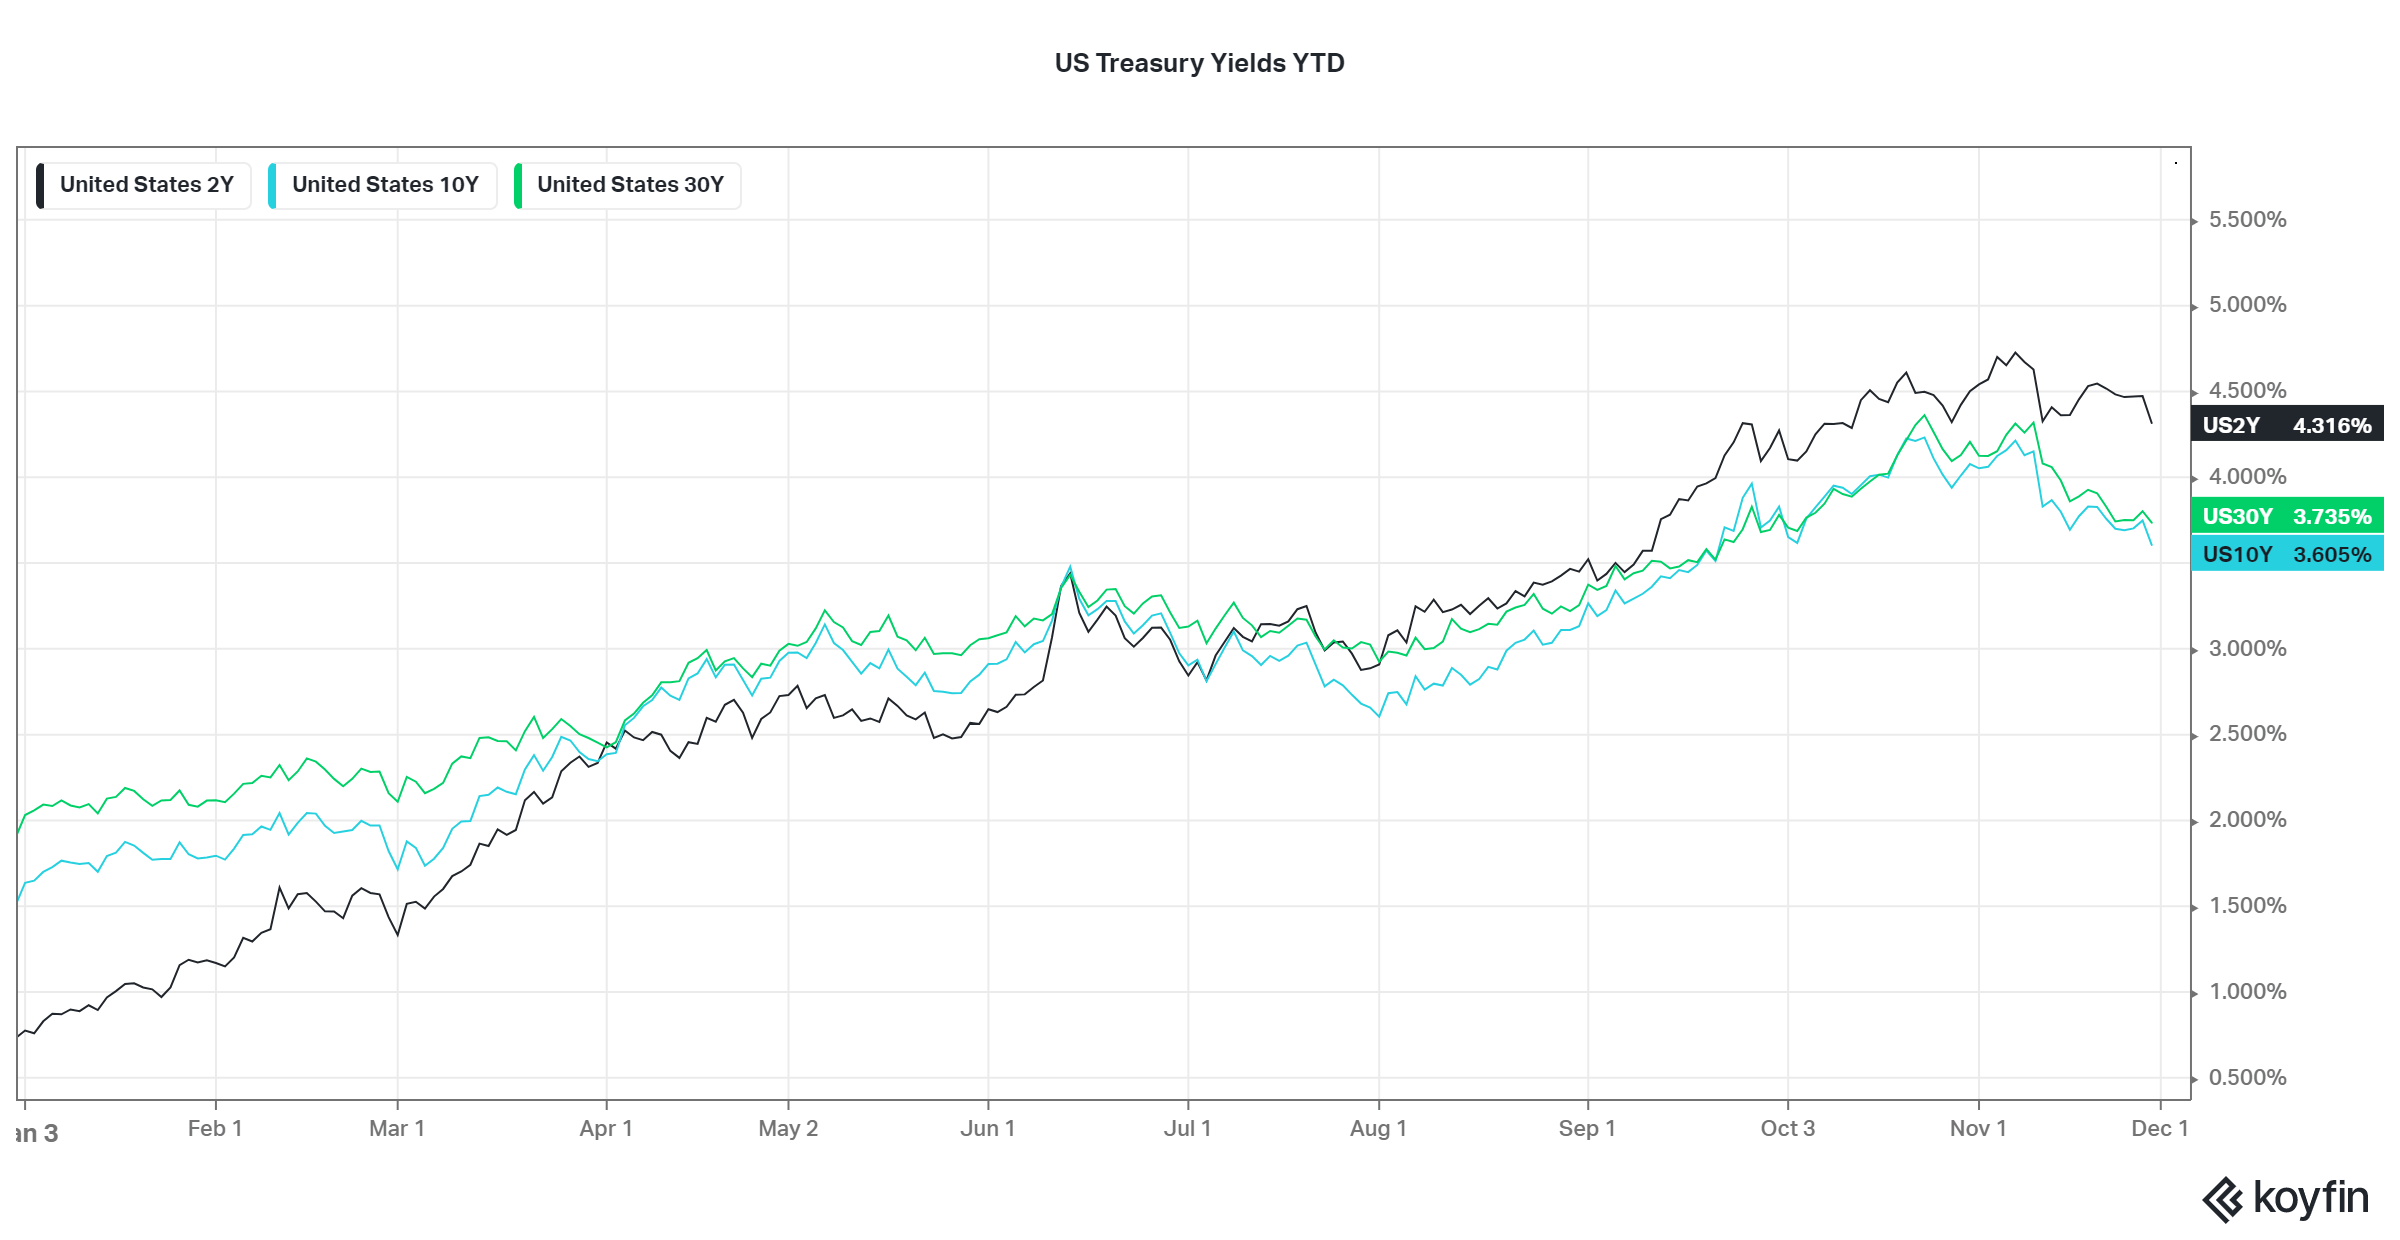
2-year Treasury rates rose from nothing to 4.3% this year so far. 10-year and 30-year Treasuries are higher too. The dramatic shift to higher rates is the reason why bond funds were hit hard this year.
The rule of thumb is for every 1% move in interest rates, expect a bond’s price to move 1%, in the opposite direction for every year of duration. So you can expect a bond fund with an average duration of 7 years, to fall roughly 7% for every 1% rise in interest rates.
So longer duration bonds tend to be riskier when rates are rising. The fact that short-term bonds offer better rates for investors is good news.
Like bond prices, stock valuations change as interest rates change. Falling rates push stock valuations higher. Rising rates push prices lower. This is especially true in the growthier stocks where future earnings forecasts were overly optimistic.
Bear markets eventually force investors, speculators, and gamblers alike to come to their senses. Expectations reset. The days when stocks only go up are over. Not every company is certain to make money. Lower, more reasonable future earnings expectations plus higher rates lead to significant losses.
But here’s more good news. Lower stock prices lead to lower valuations. And lower stock valuations, generally, lead to higher returns going forward.
More importantly, higher interest rates change the dynamic around portfolio construction and required returns. For example, a 7% return is about what you might expect from a basic 60/40 allocation. If you need a 7% return to meet your goals, in a 1% interest rate world, that stock allocation needs to do all the work. In fact, stocks must produce an 11% long-term return to meet that mark. That’s better than the historical average. Expecting more than what the market has historically delivered is what gets you into trouble.
The alternative is a higher weighting to stocks, which has challenges too like being comfortable with a more volatile portfolio. So historically low-interest rates stuck investors in a quandary: take more risk in stocks with no guarantee of earning a higher return or accept a lower return and fall short of their goals.
But that changes in a 4% interest rate world. You only need a 9% return from stocks, in a 60/40 allocation, to meet that 7% return goal. 9% is somewhat reasonable for stocks over the long run. Put another way, if rates were only 1%, you need an 80% stock allocation earning a 9% return, to hit that 7% expected return mark.
And should interest rates rise another 1% or so, that puts even less demand on the stock allocation to perform perfectly. The point is higher interest rates, while painful this year, allow for a margin of error in investors’ portfolios that didn’t exist before. It also negates much of the temptation to reach for riskier, higher-returning assets.
Lower stock valuations, with the prospect of higher returns, is icing on the cake.
Last Call
- Marks Memo: What Really Matters? – Oaktree
- Getting Wealthy vs. Staying Wealthy – M. Housel
- The Hustler: Lessons from a Young Warren Buffett – Neckar
- The Worst Bond Market Ever – J. Rekenthaler
- 8 Key Takeaways from 20 Years of SPIVA Data – Evidence Investor
- Venture Capital Red Flag Checklist – B. Gurley
- Generative AI: Autocomplete for Everything – Noahpinion
- How the Story of Soccer Became the Story of Everything – Mother Jones