The asset tables are officially updated with the total returns for 2017. Before we get to the numbers, I made a few changes to two of the tables.
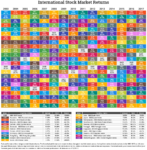
When I originally made the tables, I purposely limited the international and emerging market tables to the 12 biggest countries by market cap. It was cleaner, easier to manage, and fit on most screens. It also left out about half the countries in the MSCI EAFE and EM indexes.
So it was time for a makeover.
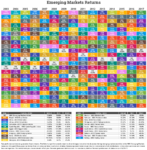
I remade both tables over the holiday break to include every country in the index – with a new color scheme – with data for the past 15 years. All the countries in the MSCI EAFE are included. Two of the MSCI EM countries didn’t make the cut – Qatar and United Arab Emirates – because neither has 15 years of data.
One of the side effects of owning index funds is how easy it is to forget you own a basket of companies. In the case of international and emerging market index funds, you own a basket of companies from over 20 countries each. So the new versions offer a better picture of how those companies perform by country and what’s driving each index.
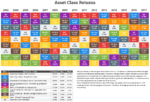
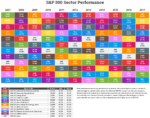
You can see version 2.0 by clicking the images of each asset table or you can download an image or PDF version here.
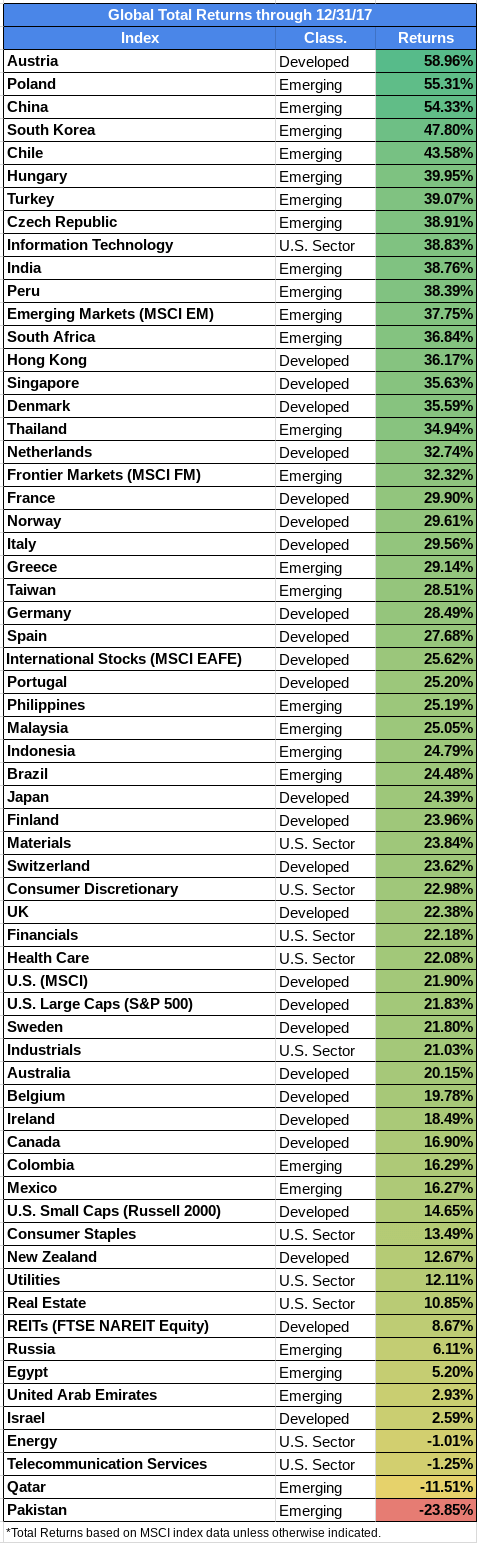
With that out of the way, let’s get to the important stuff. I added a table below comparing U.S., international, and emerging returns for the year ranked best to worst (results from the first half of 2017 are here).
Here are some quick comments on the data:
- Only two countries finished in the red for 2017: Qatar and Pakistan.
- Four countries finished with single-digit returns: Russia, Egypt, UAE, and Israel.
- The rest – 41 countries total – had double-digit returns.
- 35 of those countries had returns greater than 20%, 16 were over 30%, and 5 topped 40%.
- 32 countries, along with MSCI EAFE and EM, outperformed the U.S.
- Two sectors in the U.S. finished in the red: Energy and Telecoms
- And Technology was the best performing U.S. sector at 38.8%
Overall, it was a great year for stocks.
Still, if you need a reason to invest globally, the diversification is nice when the U.S. has a bad year. It’s just as nice when the U.S. has a great year, but it’s not the best performing market around the globe.
The table includes emerging and international market total returns, along with U.S. sector and equity asset class total returns for 2017.