Current Interactive Tables
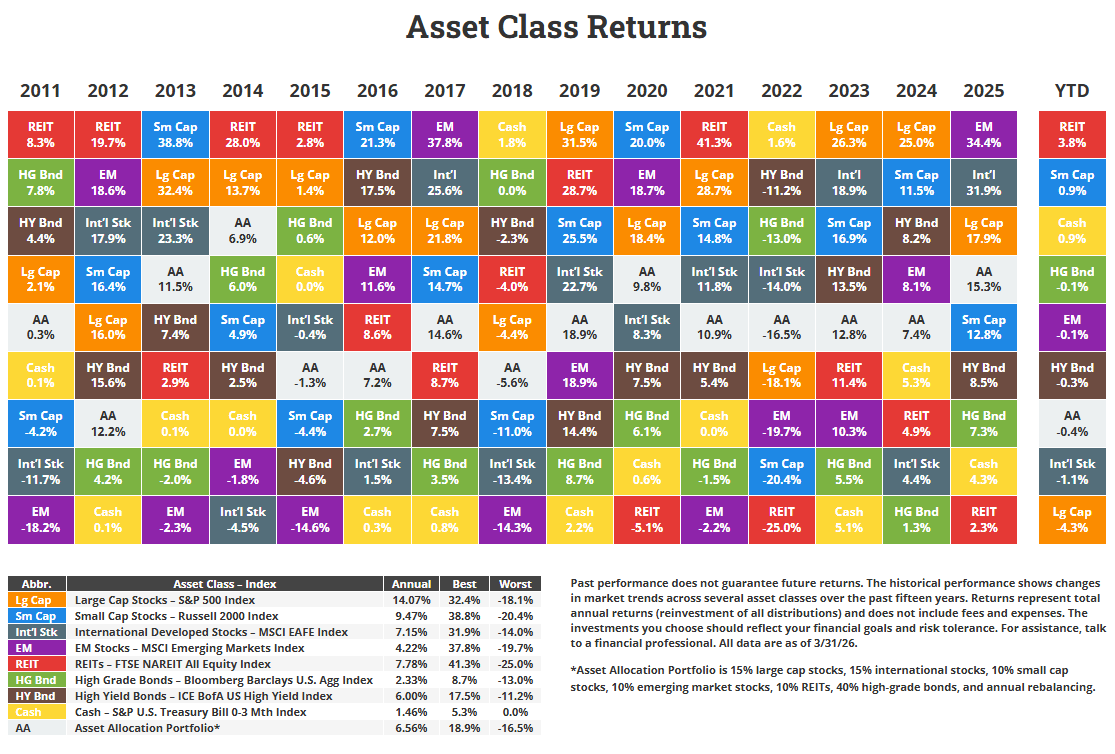
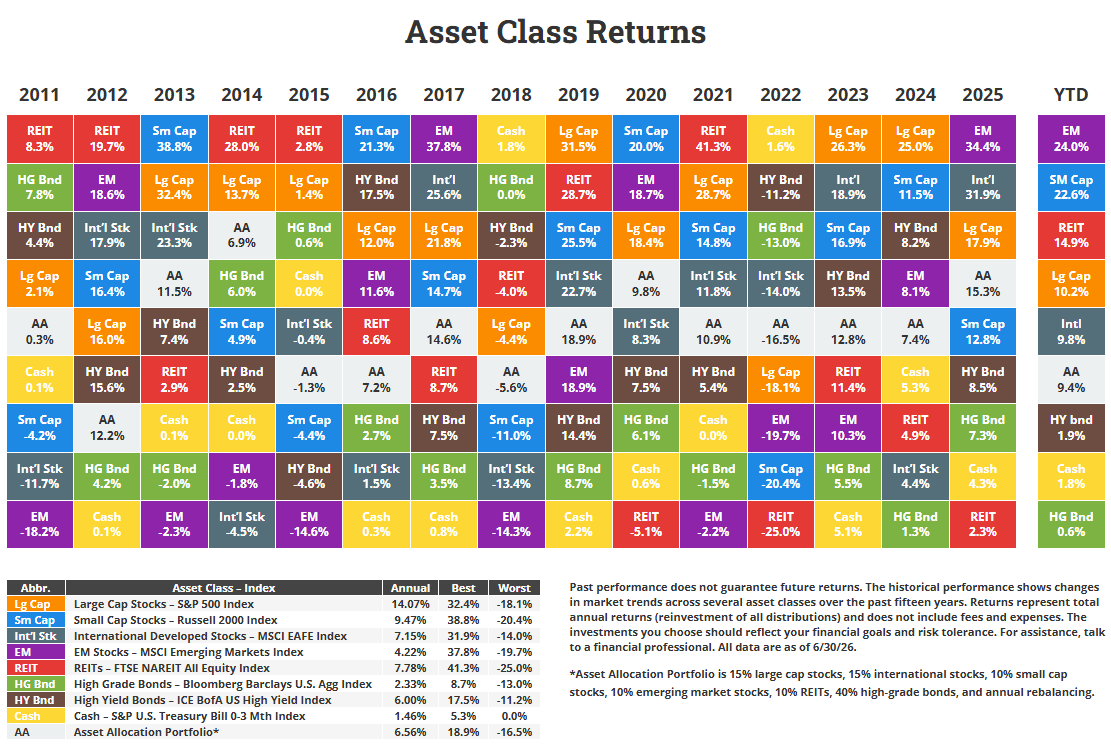
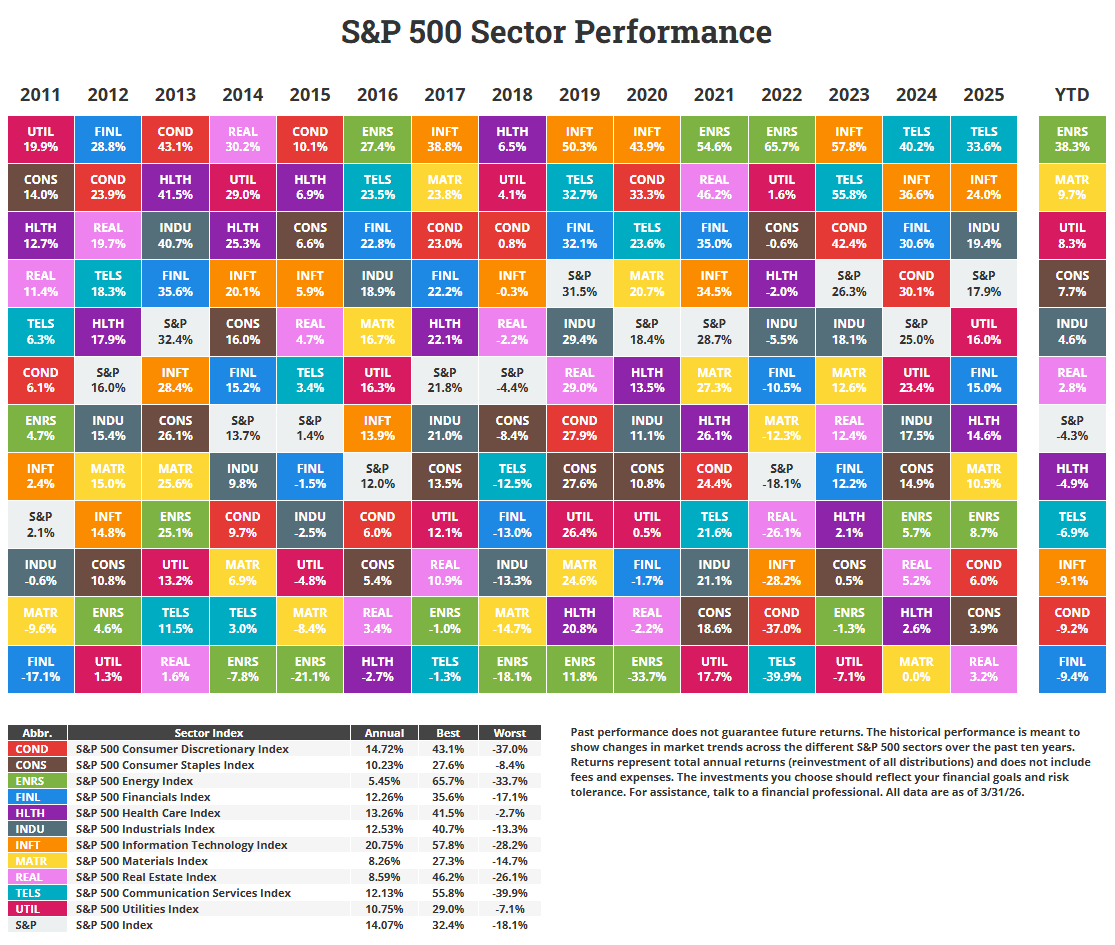
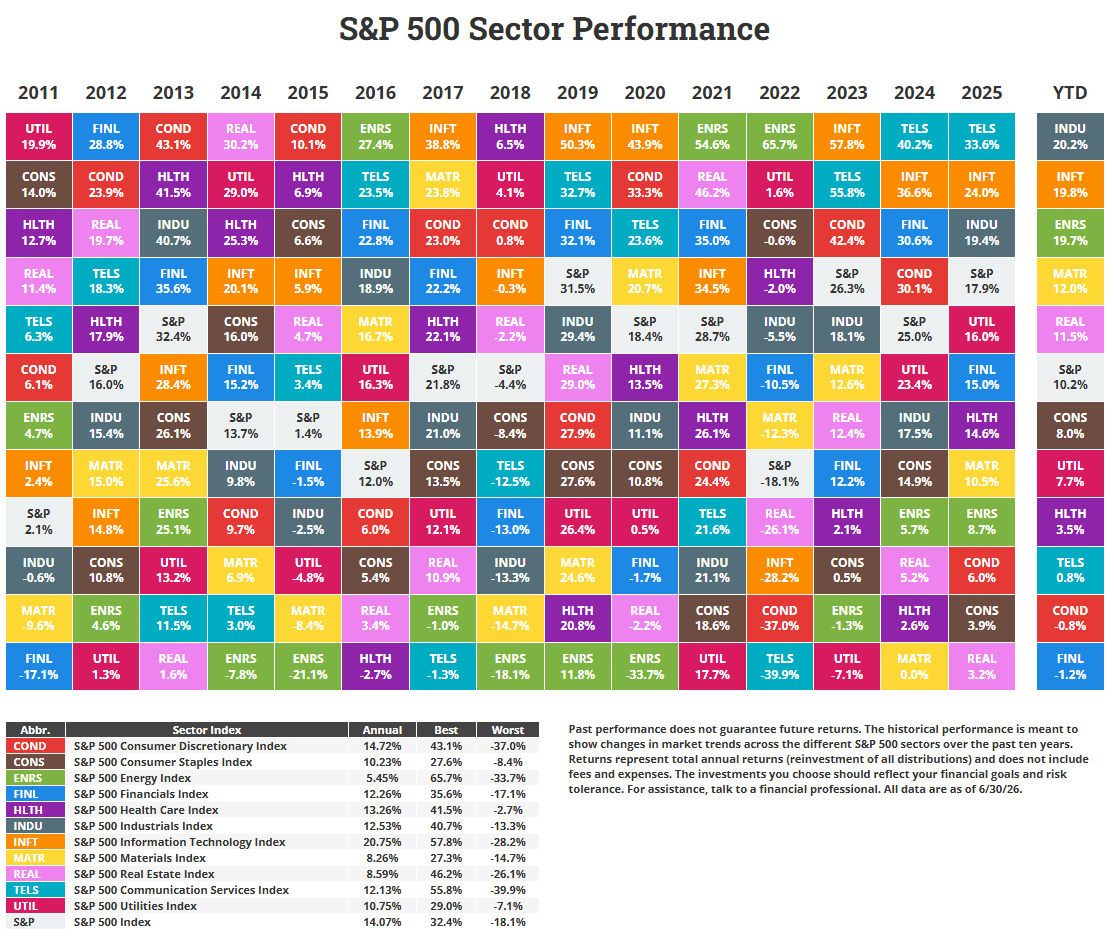
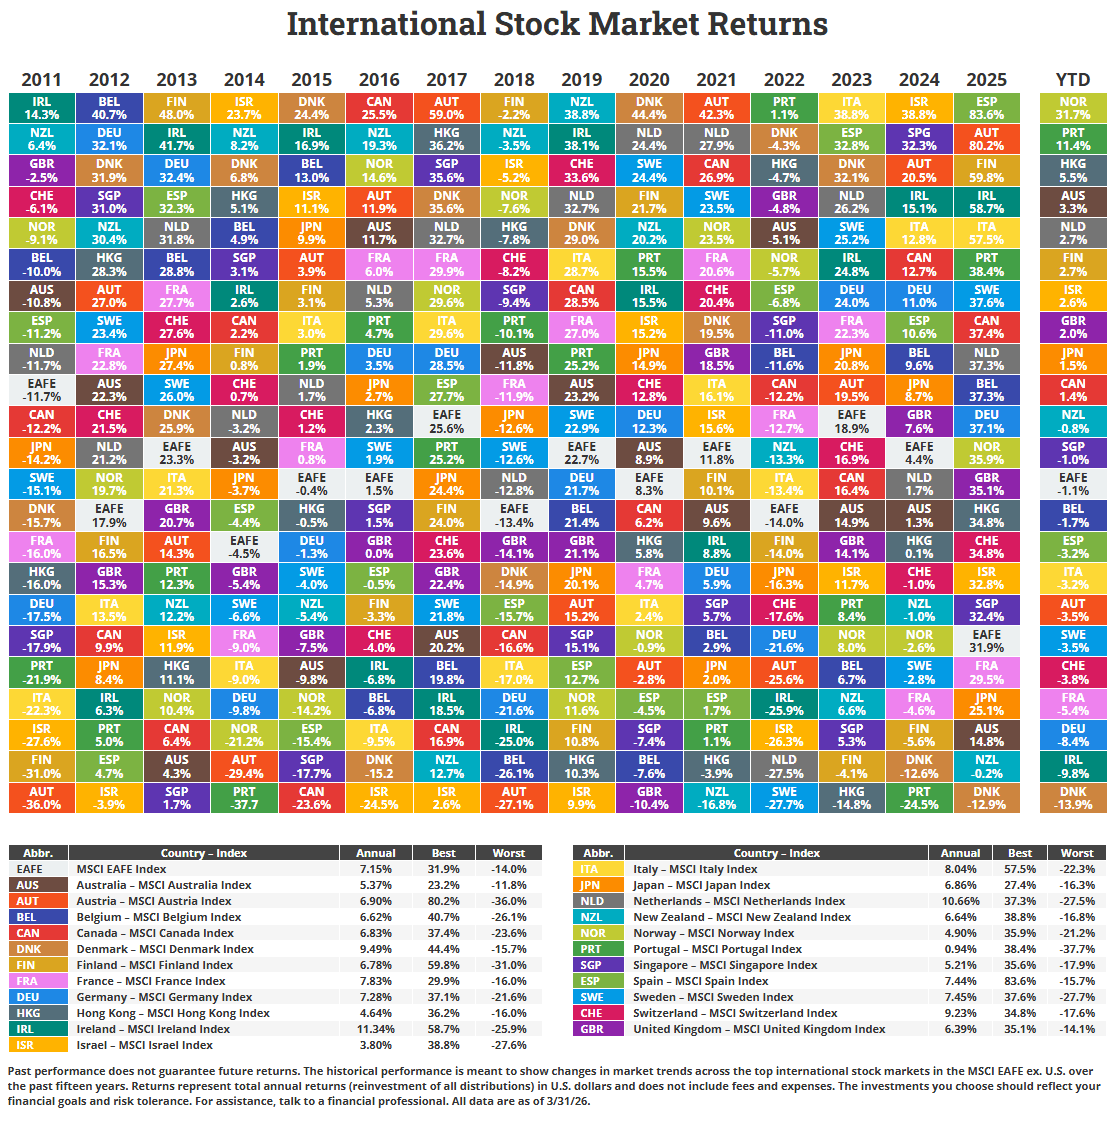
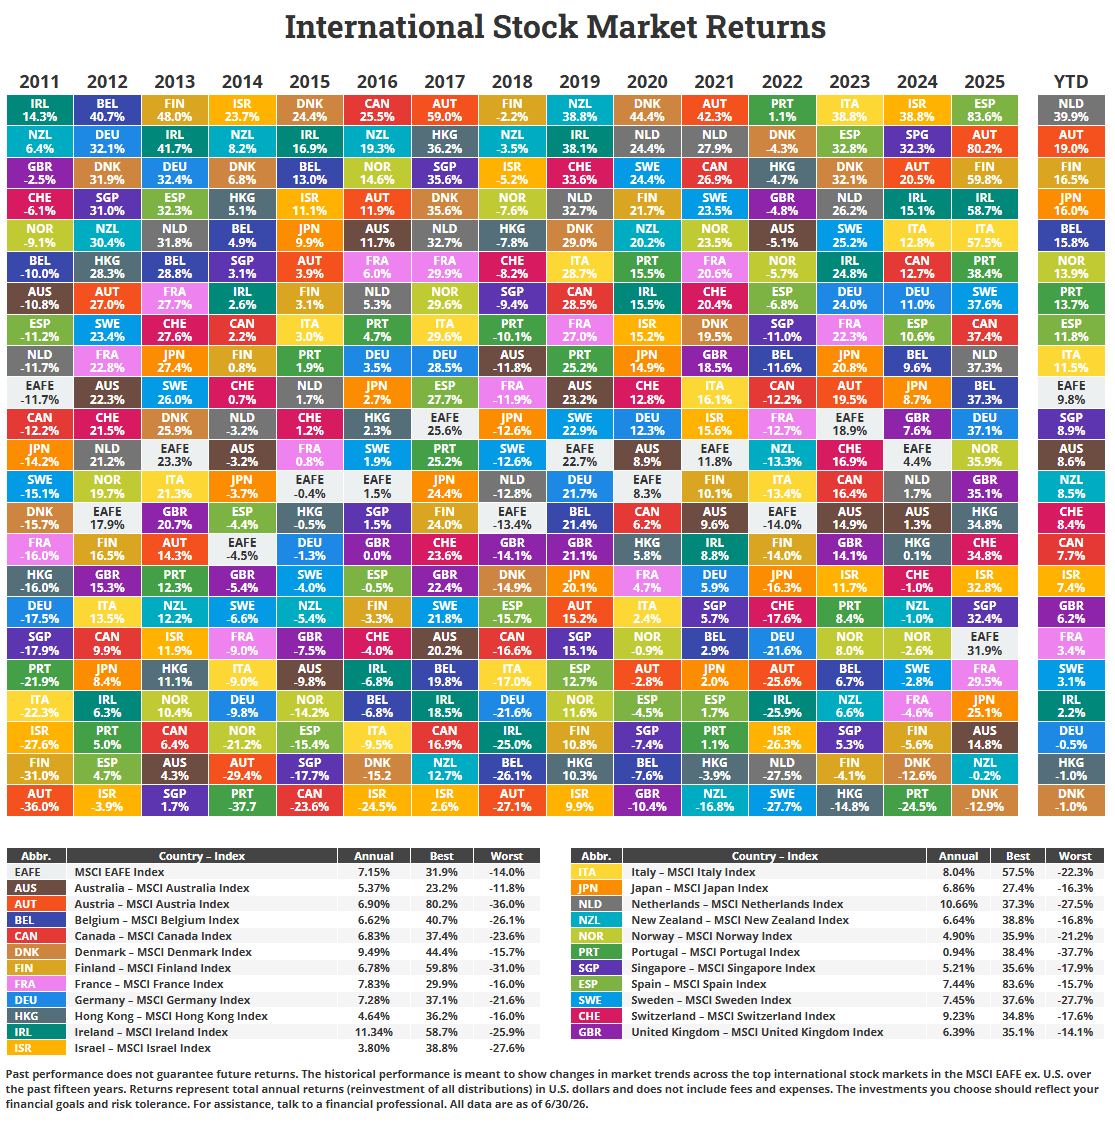
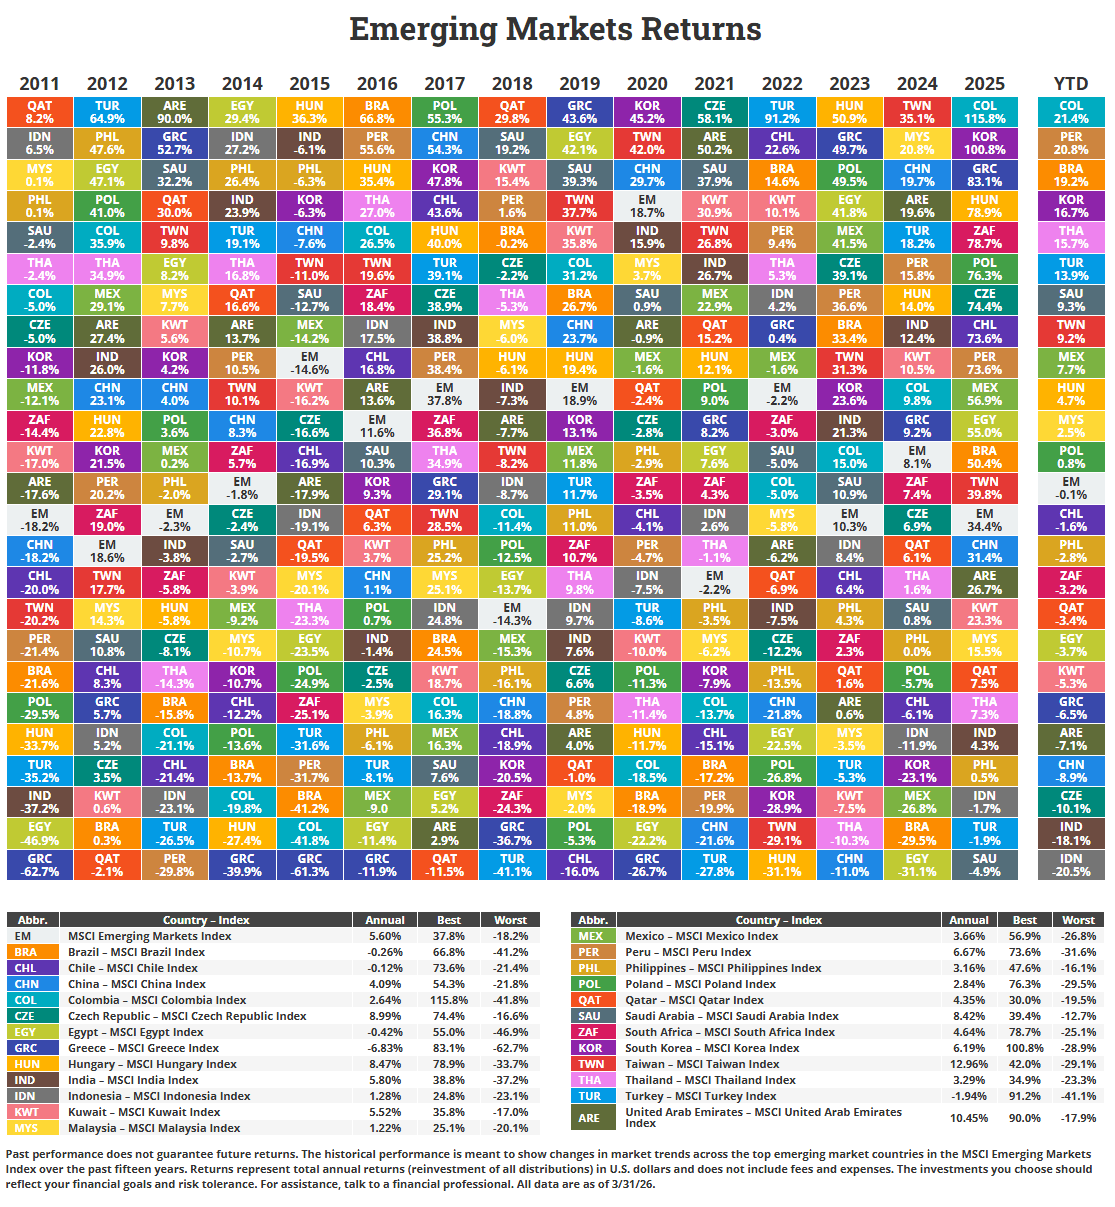
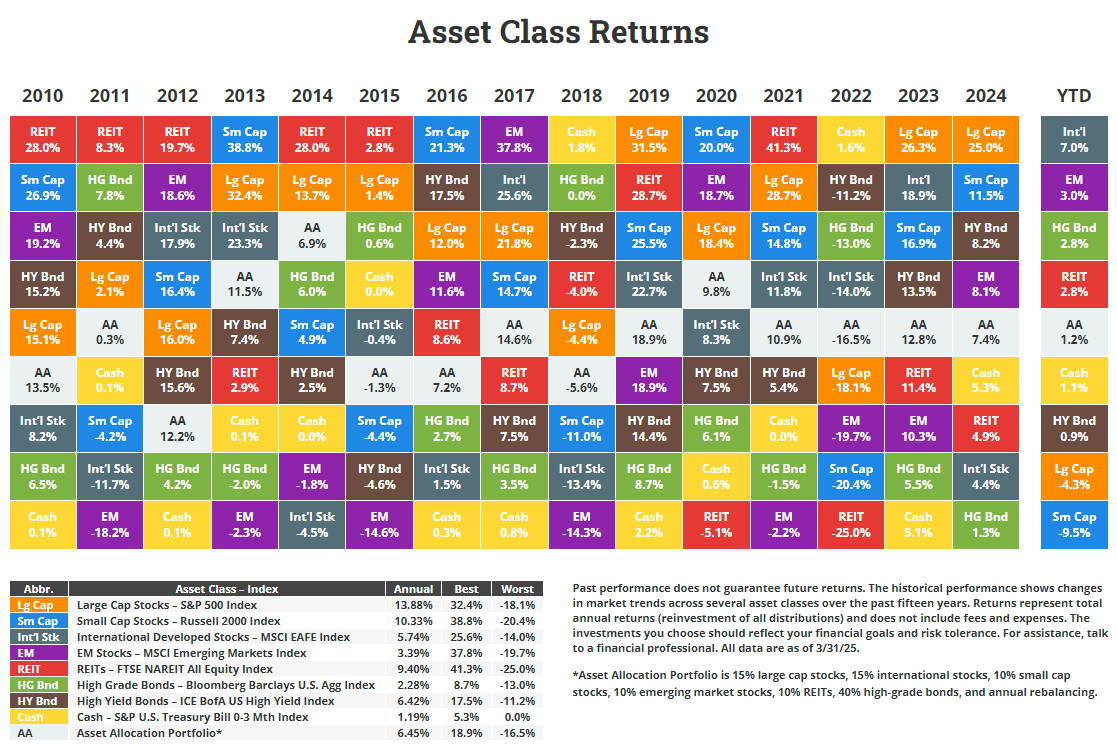
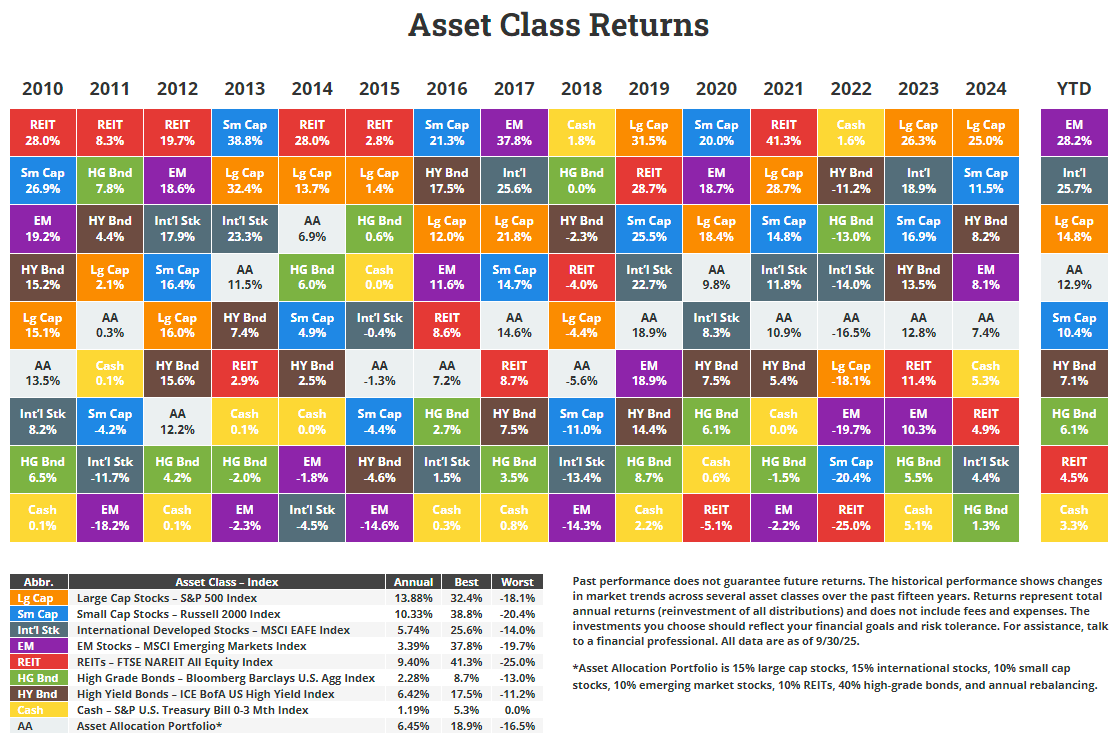
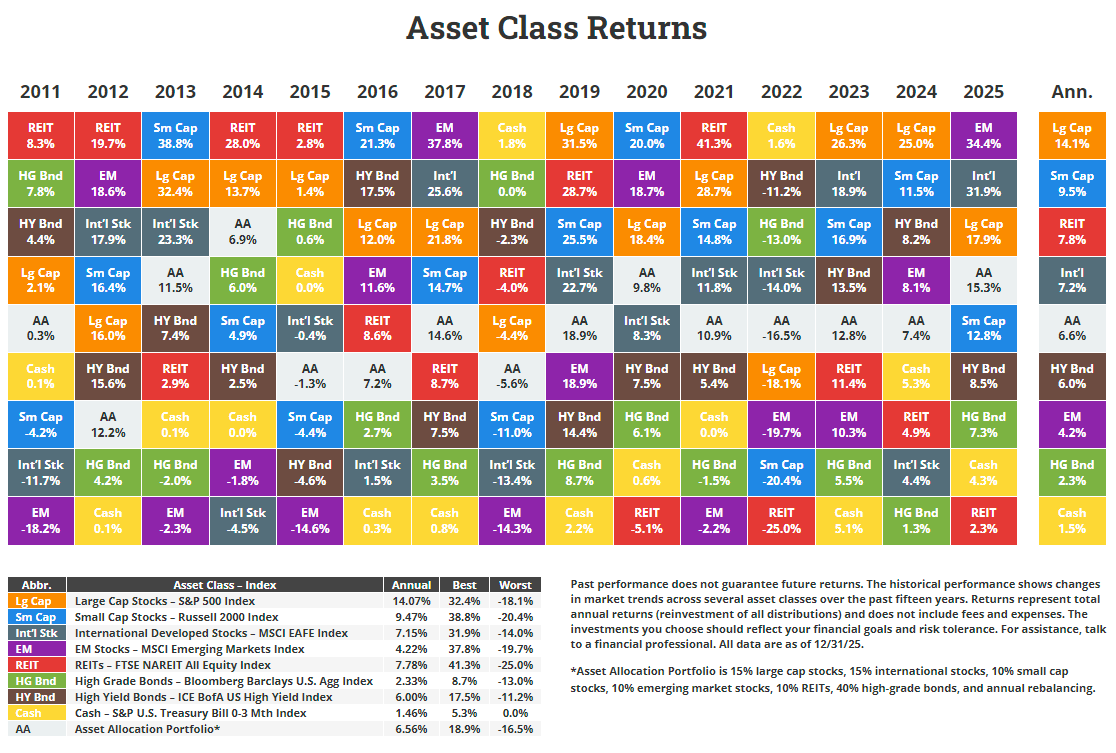
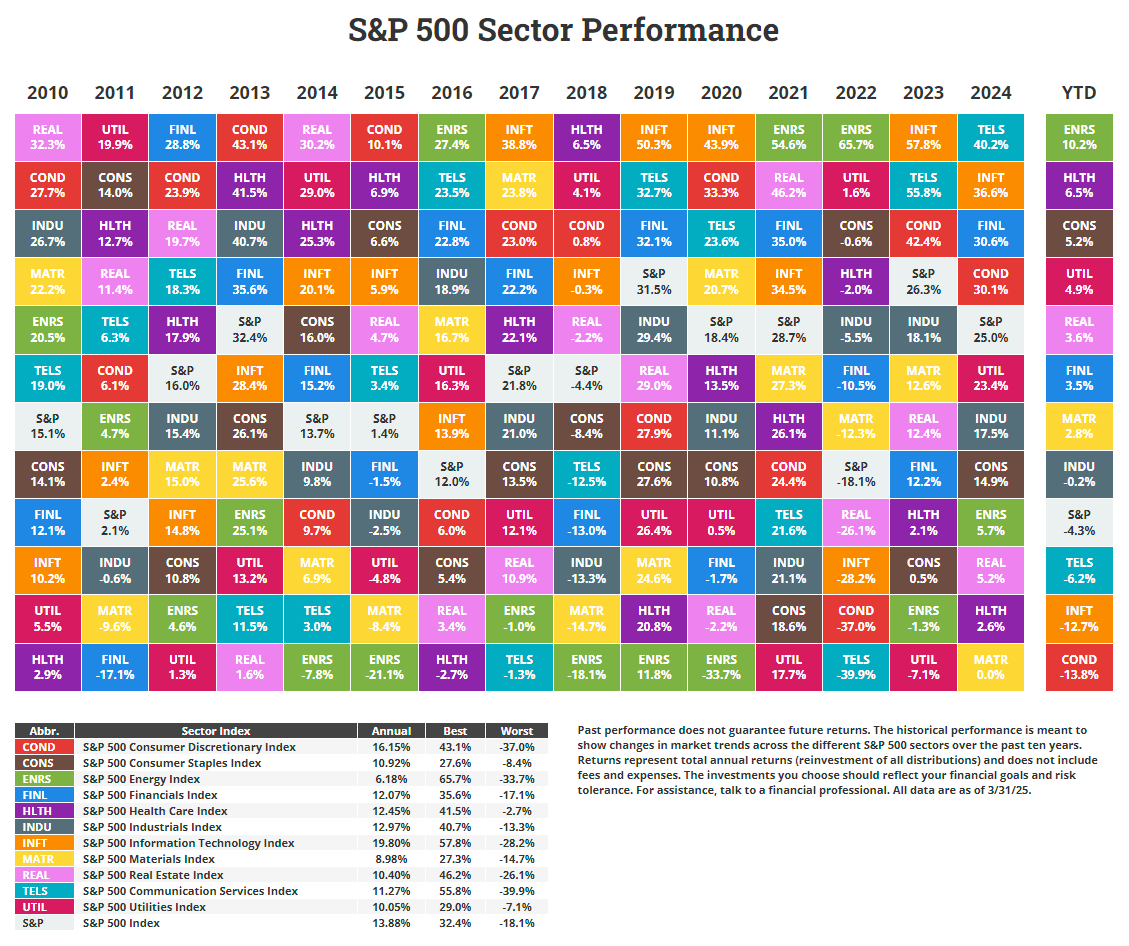
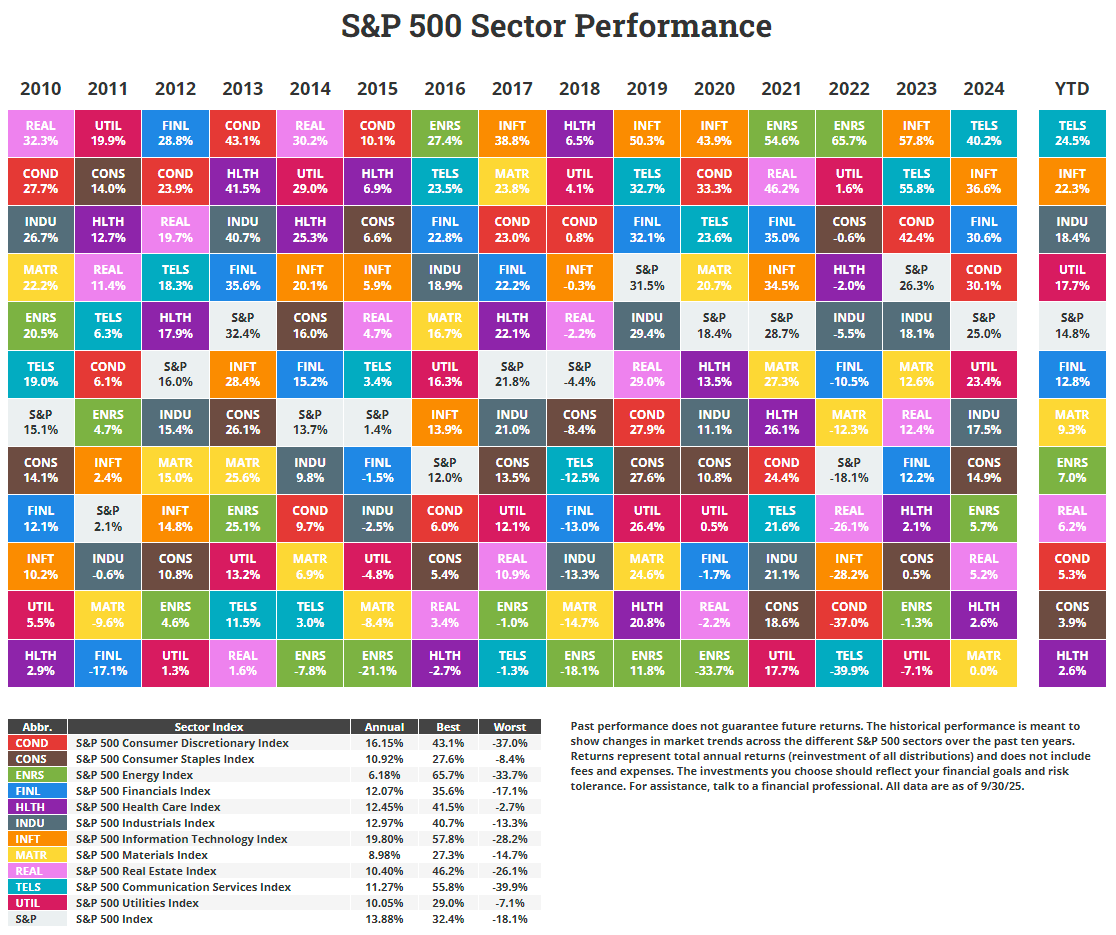
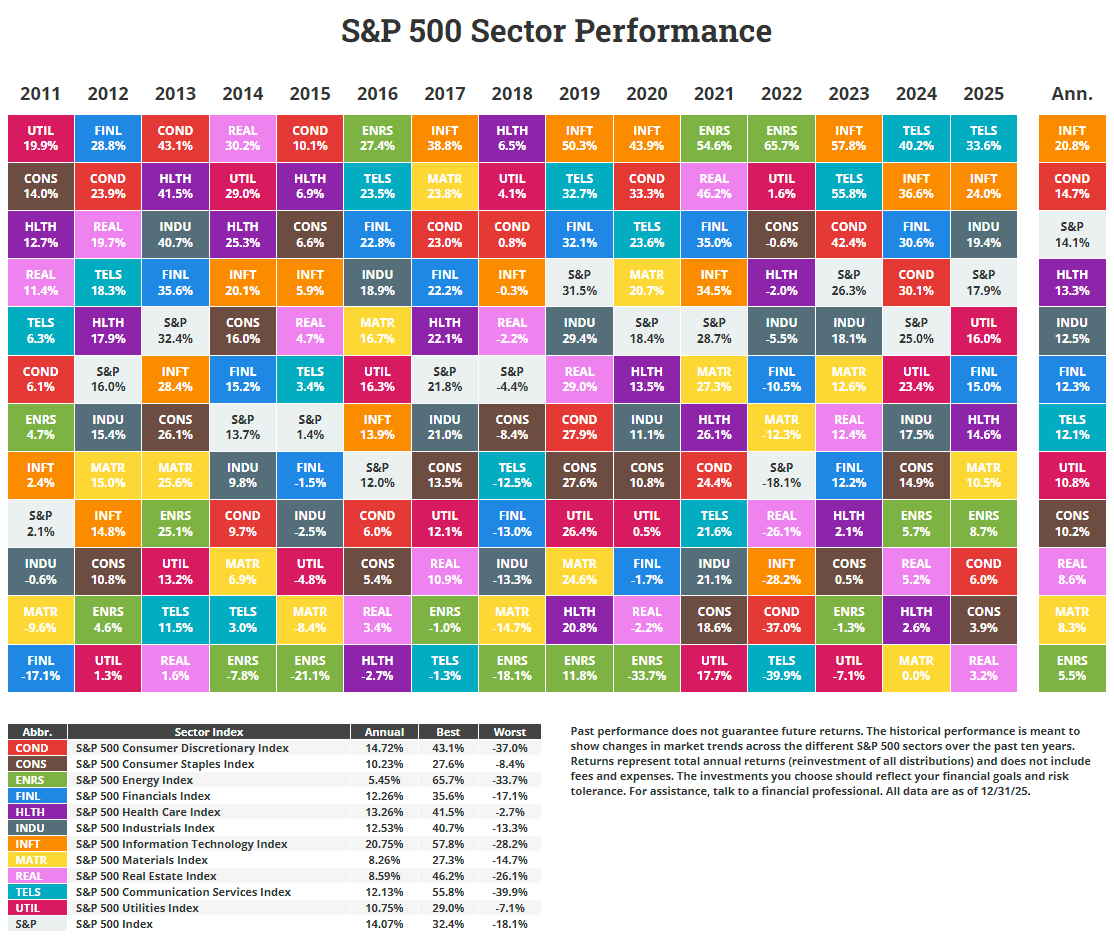
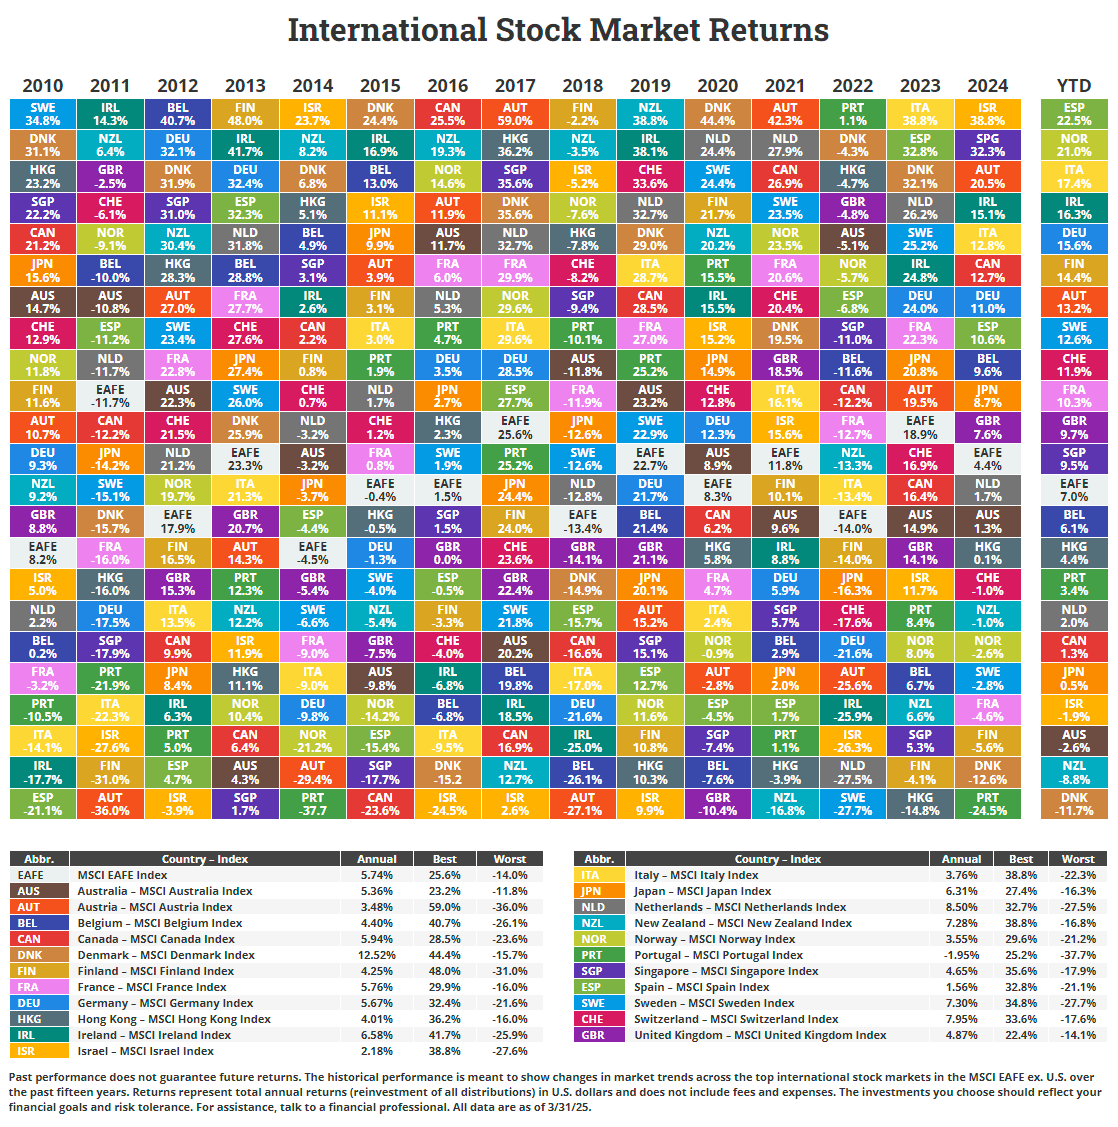
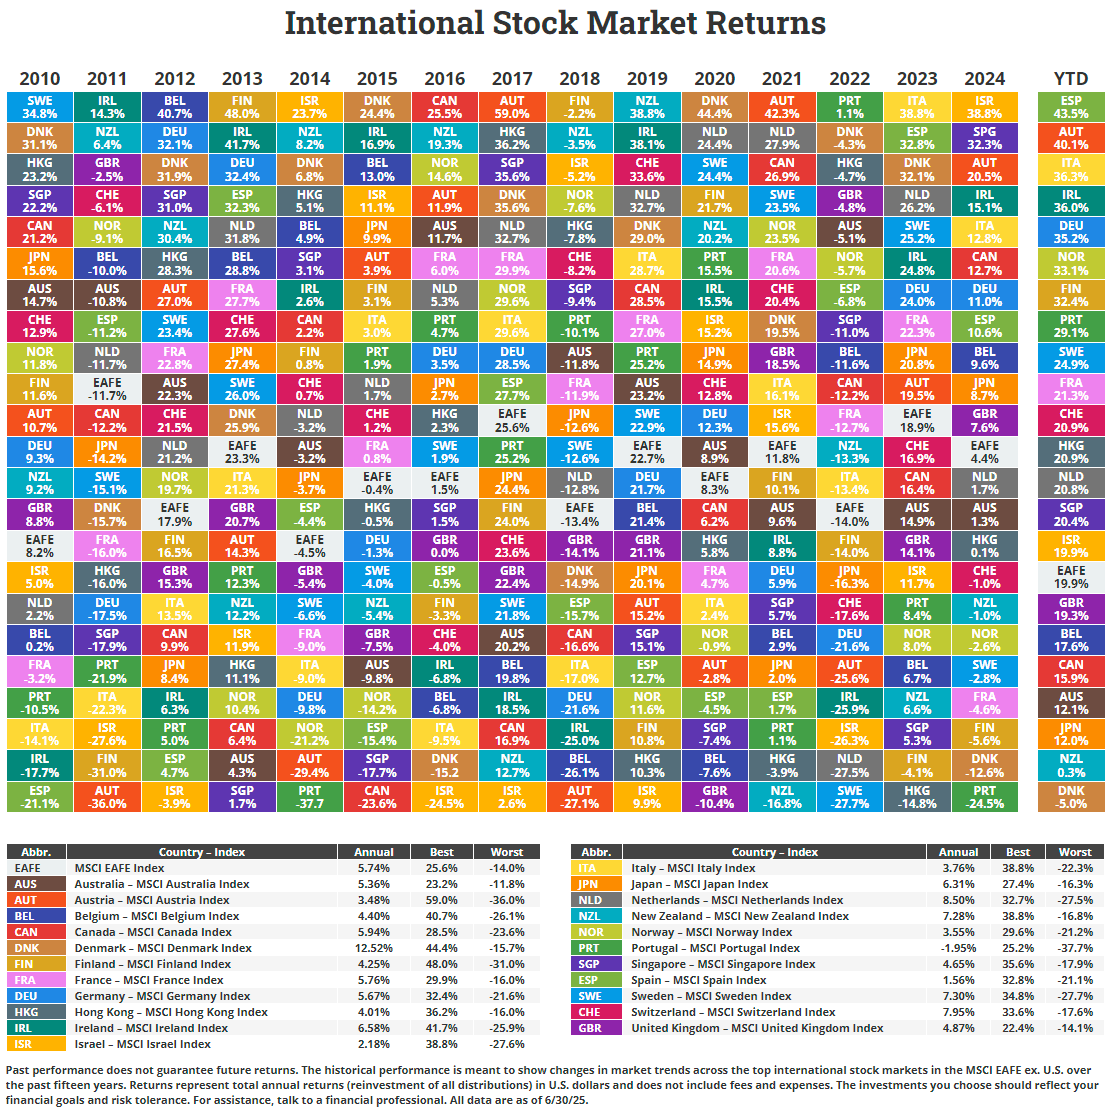
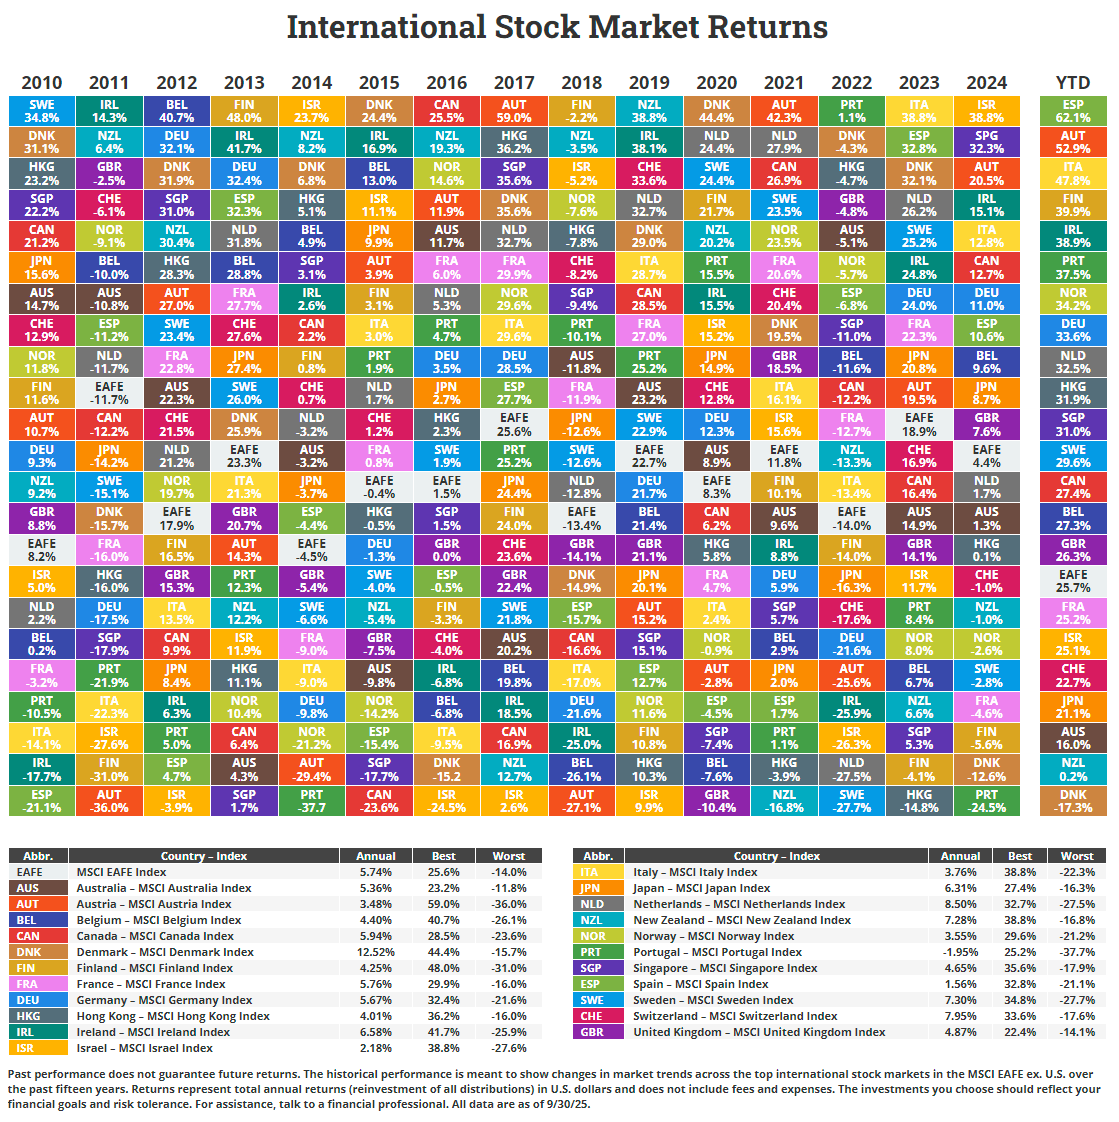
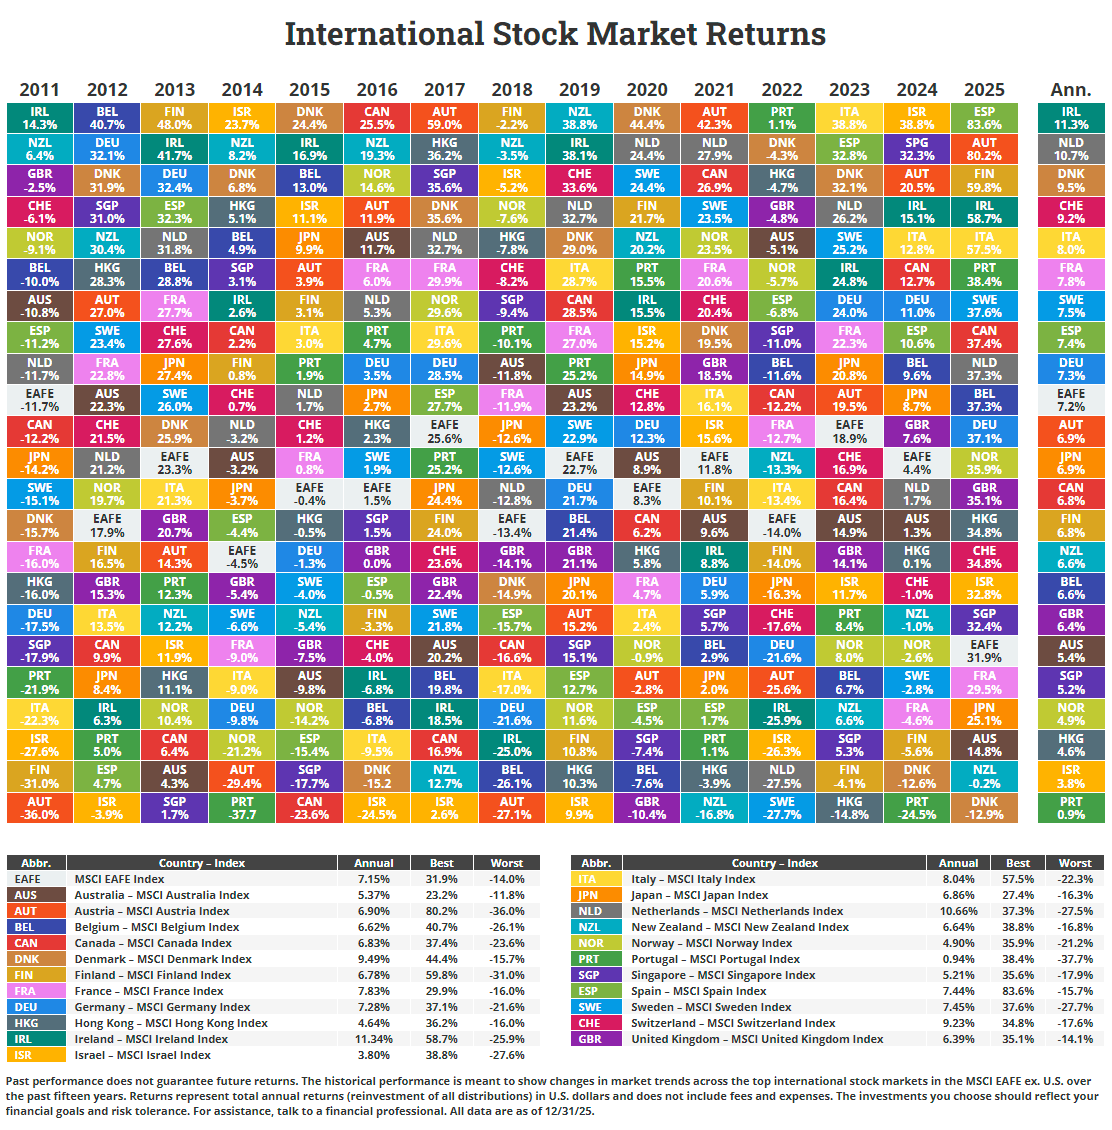
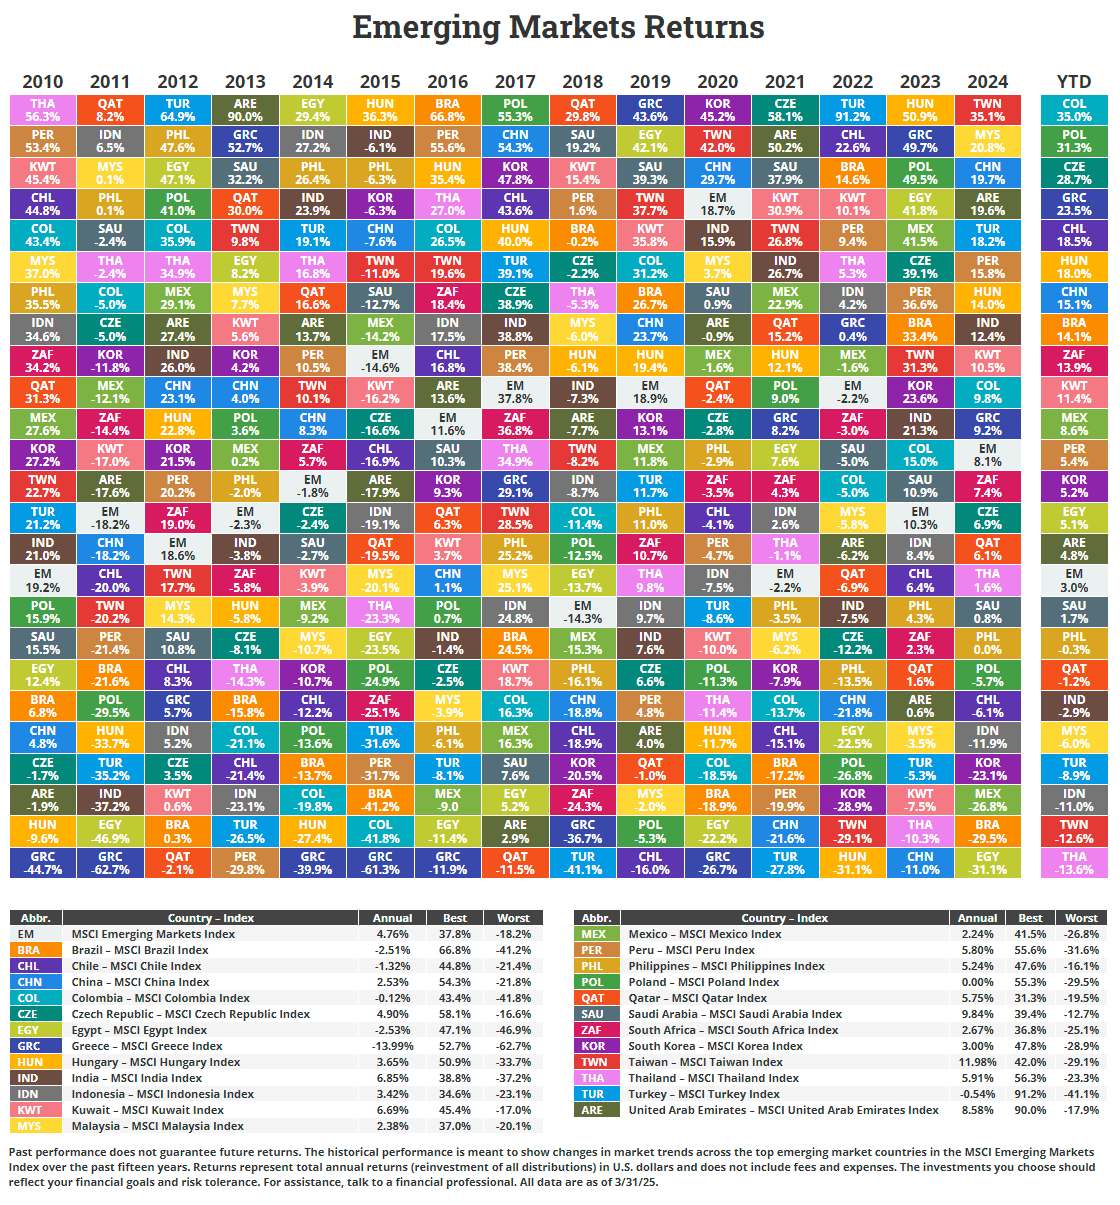
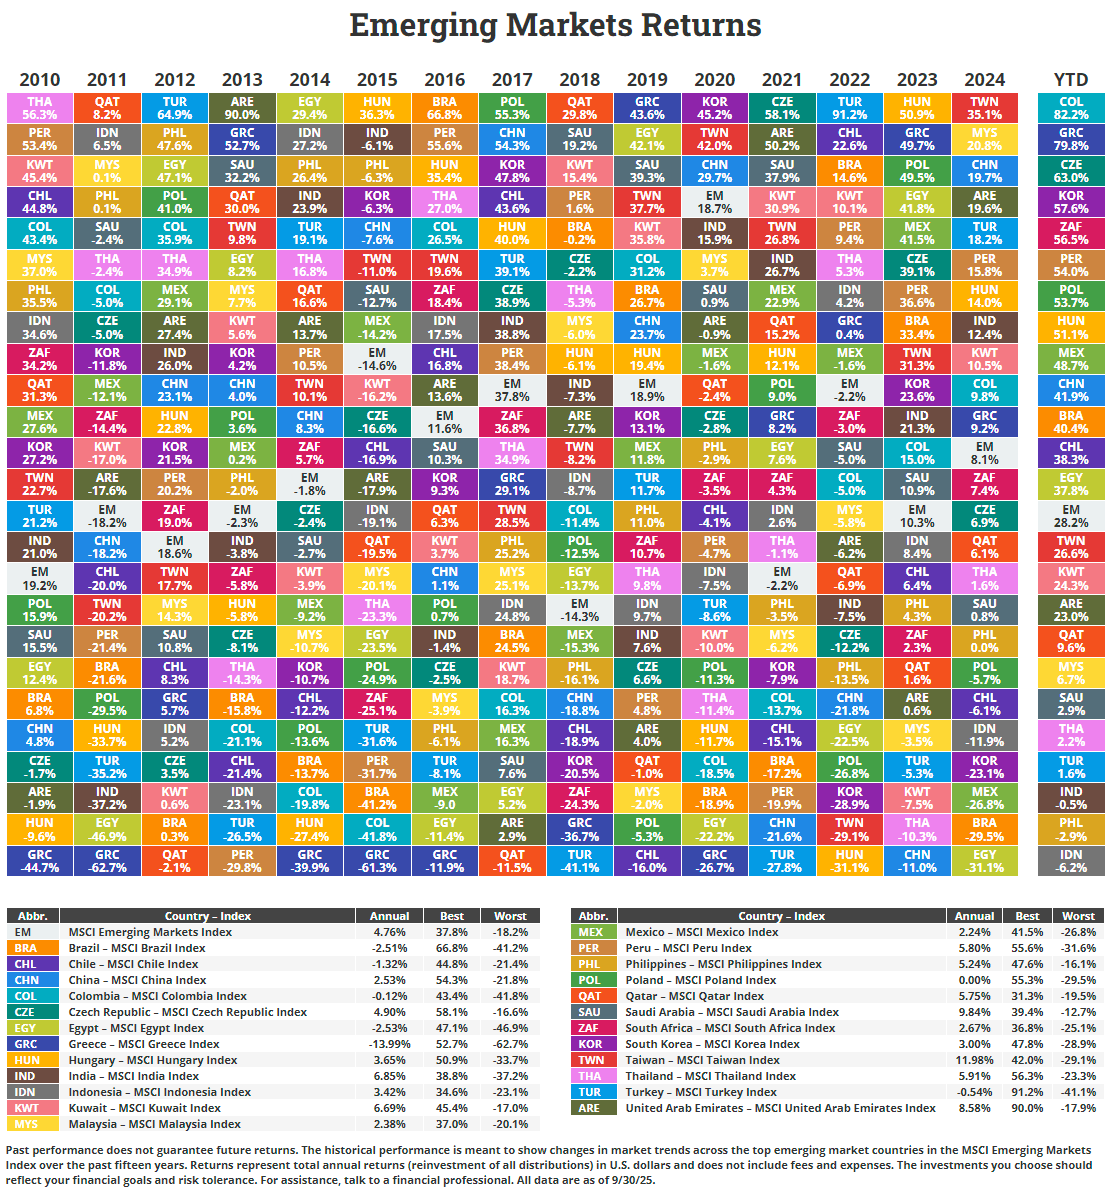
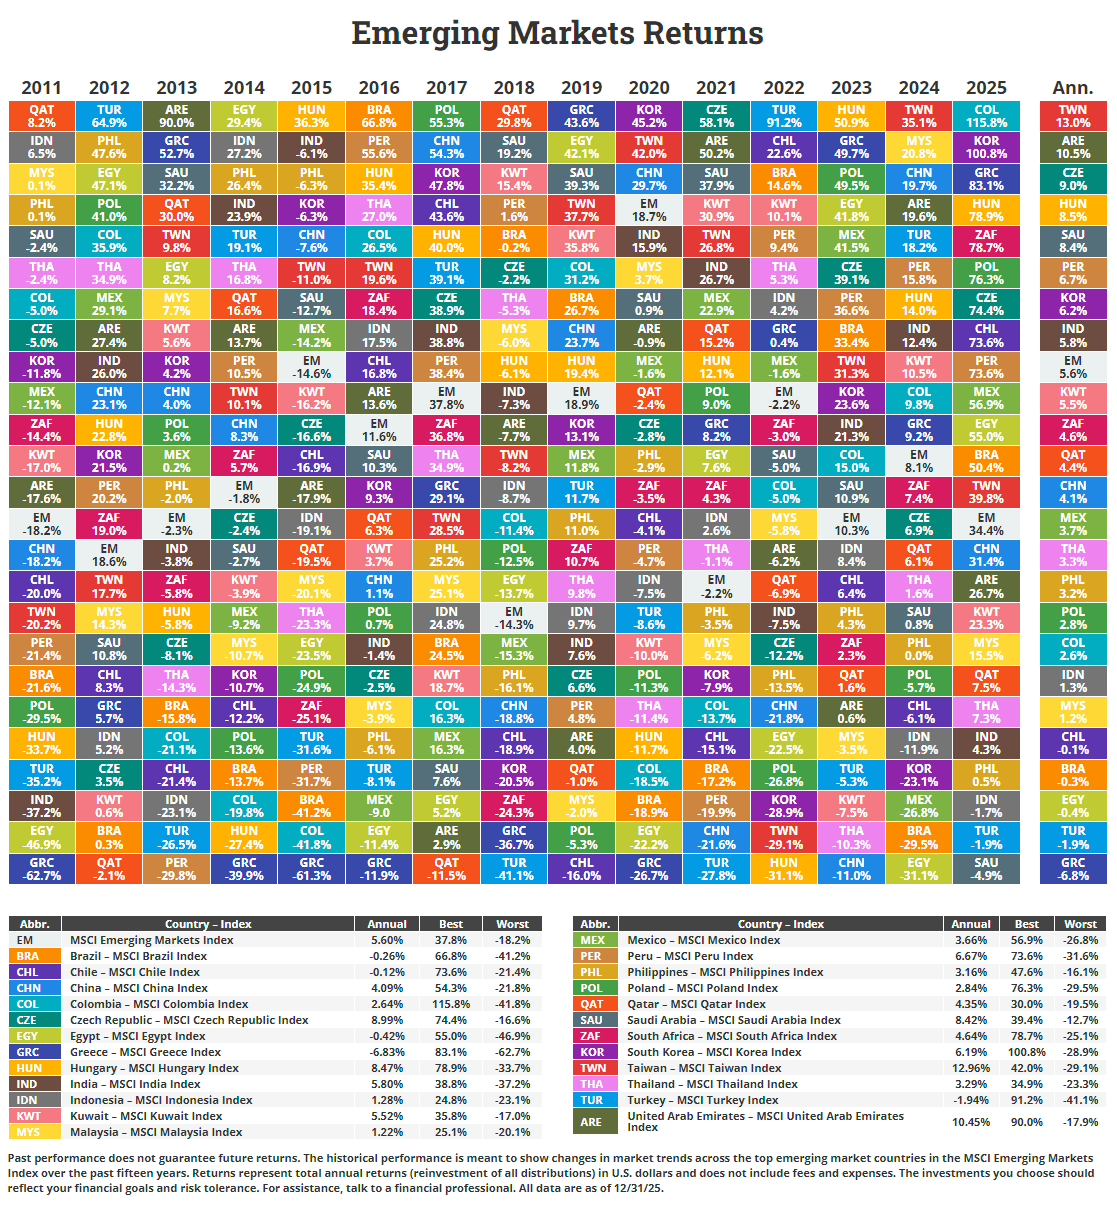
The tables compare returns over the past fifteen years for asset classes, sectors, and markets. Each table is updated every quarter.
Downloadable Images of Past Tables
Did you like the interactive return tables? Grab a copy.
You have my permission to use any images below. Though, if you happen to use it on your site, a little credit – a simple link back to my site – would be a nice gesture.
You can find download links below, broken down by year. Clicking a link will bring up the image to download it, or Right Click -> Save as…
2026
- Asset Class Table: Q1, Q2, Q3, Q4
- S&P Sector Table: Q1, Q2, Q3, Q4
- International Table: Q1, Q2, Q3, Q4
- Emerging Table: Q1, Q2, Q3, Q4
2025
- Asset Class Table: Q1, Q2, Q3, Q4
- S&P Sector Table: Q1, Q2, Q3, Q4
- International Table: Q1, Q2, Q3, Q4
- Emerging Table: Q1, Q2, Q3, Q4
2024
- Asset Class Table: Q1, Q2, Q3, Q4
- S&P Sector Table: Q1, Q2, Q3, Q4
- International Table: Q1, Q2, Q3, Q4
- Emerging Table: Q1, Q2, Q3, Q4
2023
- Asset Class Table: Q1, Q2, Q3, Q4
- S&P Sector Table: Q1, Q2, Q3, Q4
- International Table: Q1, Q2, Q3, Q4
- Emerging Table: Q1, Q2, Q3, Q4
2022
Full Year
First Half
2021
Full Year
First Half
2020
Full Year
First Half
2019
Full Year
First Half
2018
Full Year
- Asset Class Table: Image or PDF
- S&P Sector Table: Image or PDF
- International Table: Image or PDF
- Emerging Table: Image or PDF
First Half
- Asset Class Table: Image or PDF
- S&P Sector Table: Image or PDF
- International Table: Image or PDF
- Emerging Table: Image or PDF
2017
Full Year
- Asset Class Table: Image or PDF
- S&P Sector Table: Image or PDF
- International Table: Image or PDF
- Emerging Table: Image or PDF
First Half
- Asset Class Table: Image or PDF
- S&P Sector Table: Image or PDF
- International Table: Image or PDF
- Emerging Table: Image or PDF
2016
Full Year
- Asset Class Table: Image or PDF
- S&P Sector Table: Image or PDF
- International Table: Image or PDF
- Emerging Table: Image or PDF
First Half
2015
Full Year
First Half
2014
Full Year
First Half