Fifteen years ago, the U.S. stock market was nine months removed from its lowest point this century. The subprime mortgage crisis shook the world and panic spilled into the stock market.
Nobody knew it then, but the market bottomed in March 2009. From 2010 to the end of last year, the market went on an unreal run that nobody expected because stocks were the last place anybody wanted to put their money.
Contrast that period to today. U.S. stocks are all anyone talks about. Not international stocks. Not emerging markets. Not bonds. It’s U.S. stocks, specifically large cap tech.
Humans are weird like that. Hindsight softens the blow of the worst market moments with every passing year, making it easier to forget how risky assets like stocks can be, especially when recent performance is exceptional.
And the S&P 500 has been exceptional. It’s seen double digit returns each of the last six years. One of those years was an 18.1% loss. Of the other five years, one was in the teens at 18.4%, the rest ranged from 25.0% to 32.5%.
2018 was the last time the S&P 500 had a single digit return. It was a 4.4% loss, the first losing year since 2008. The S&P 500 followed up the worst financial crisis since the Great Depression with a 13.9% annual return and only two losing years through 2024.
Of course, prior to that the S&P experienced the “lost decade.” Large caps lost 1% per year including dividends from 2000 to 2009. REITs performed best over the same period at 10.6% per year. Emerging markets — the worst performing equity asset class the past 15 years — followed closing behind REITs at 10.1%. Small caps, international stocks, bonds, and your savings account beat the S&P 500. Yet, more of the same for large caps was the incorrect expectation.
And why did the S&P 500 perform so poorly for 10 years? Because of its wonderful performance the decade prior that ended in the Dotcom bubble.
Markets are weird like that. The worst performing asset class, that nobody wants to own, can often become the best asset to own. While the most popular asset class to own ends up disappointing. Yet, investors often miss out on the former and suffer with the latter because they tend to imbue permanence to returns based on the recent past, only to find out that nothing performs incredibly or horribly forever in investing.
The great lesson of the past 25 years (and century before that) is that great market runs start when things seem horrible and end when things seem incredible. If you’re expecting another decade or more of large cap dominance, the odds are against you.
Of course, that’s not to say that large caps should be avoided at all costs. The advantage of a diversified portfolio is the acceptance that these things move in unpredictable cycles. The great large cap run will be replaced by another, and your portfolio is already prepared for it. Until then, a little caution and lowered expectations never hurt after such a wonderful run.
A note before getting to the 2024 numbers. The asset class, sector, international markets, and emerging market return quilts are up-to-date through for 2024. Hit the links for each one.
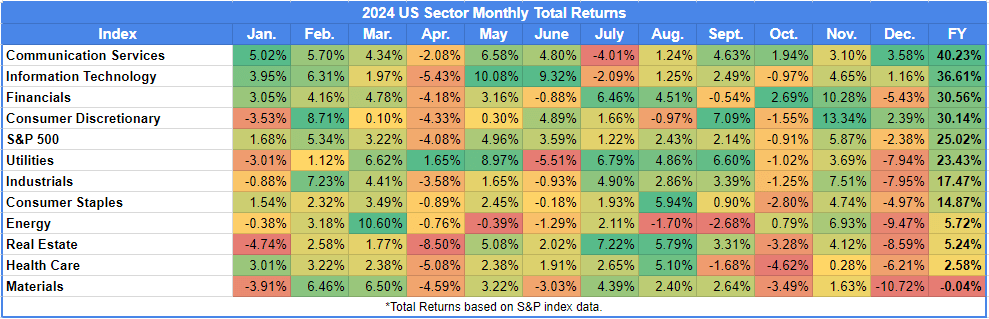
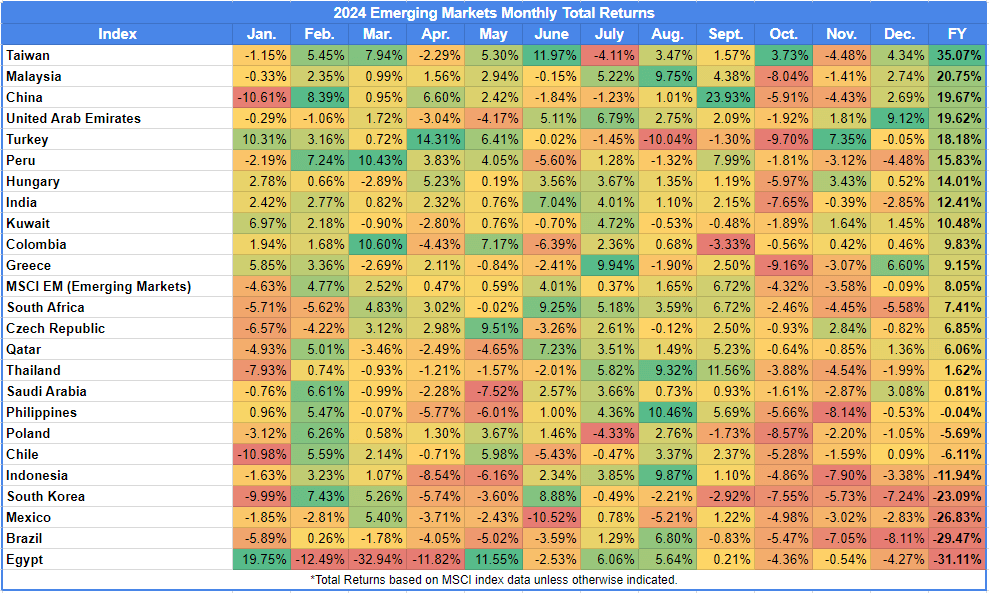
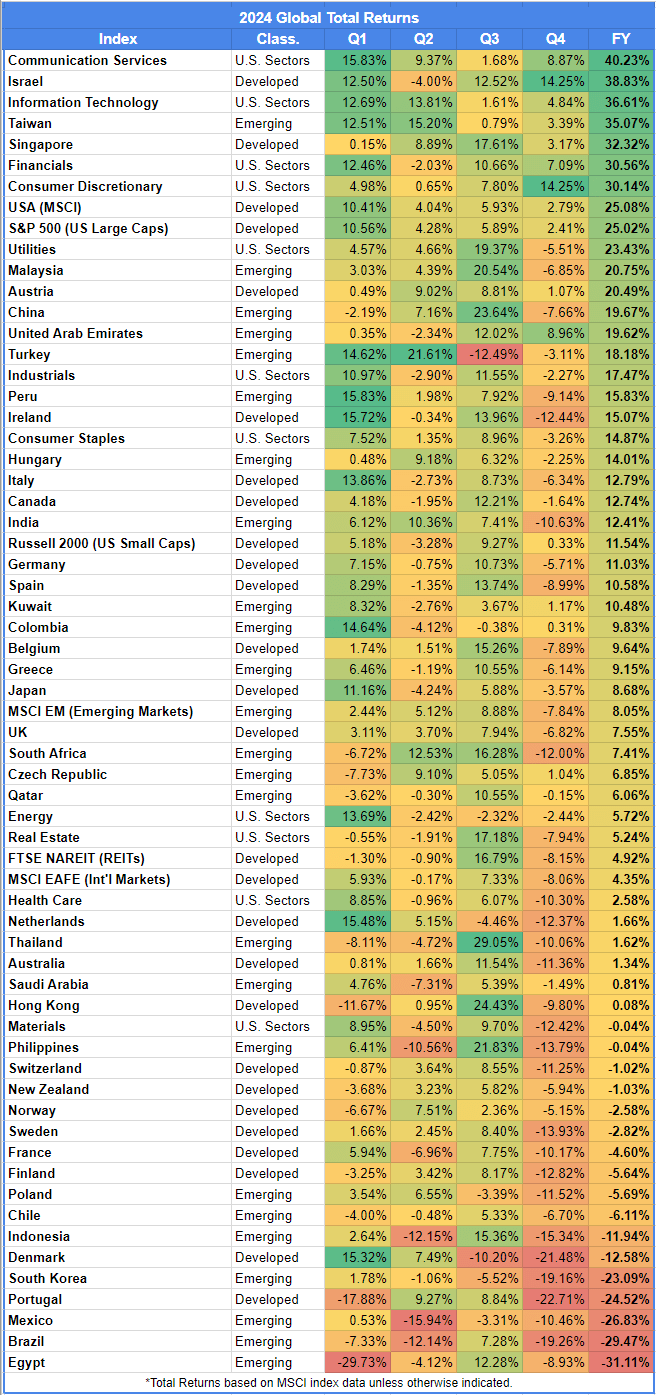
Four tables are below. The U.S. sector, developed markets, and emerging markets tables break down 2024’s returns by month. The global returns table shows the quarterly returns for the year.
The biggest highlight, as discussed above, is that U.S. large caps crushed it again this year. The S&P 500 earned a 25% total return. In fact, all broad asset classes finished positive for the year.
Here’s a few more highlights from all the charts:
- The S&P 500’s 25% return was a smidge less than its return last year and the fifth highest for the index over the last 15 years. 2013, 2019, 2021, and 2023 — weirdly in that order — were better.
- Only three countries produced double digit annual gains since 2010: U.S. at 13.9%, Denmark at 12.5%, and Taiwan at 12%.
- The worst performing countries (annual total returns) in the last 15 years: Greece at -14.0%, Egypt at -2.5%, Brazil at -2.5%, Portugal at -2.0%, Chile at -1.3%, Turkey at -0.5%, Colombia at -0.1%, and Poland at 0.0%. All are perfect examples of the risk of home country bias.
- When you break down the S&P 500 by sector, it’s clear what the main driver is: Info Tech returned 19.8% per year since 2010. Consumer Discretionary is the only other sector to outperform the index with a 16.2% total annual return over the same period.
- Last year, I highlighted China’s three consecutive losing years from 2021 to 2023. The streak ended this year with a 19.8% gain. (Only one emerging market experienced a longer streak of losses since 1988: Thailand at four years.)
- Finland currently has three consecutive losing years after this year’s 5.6% loss.
- The U.S.’s Communications Services sector outperformed every other sector and country in 2024 with a 40.2% total return.
- Materials was the lone U.S. sector to (barely) end the year with a loss of 0.04%.
- The best performing sector through September 2024 was Utilities at 30.6% but ended the year at 23.4%, due to an 8% loss in December. Healthcare, Real Estate, and Materials also saw big losses in December. It’s a great example of how quickly things can turn in a single month.
- In fact, only four sectors experienced gains in the last quarter of 2024: Communication Services, Info Tech, Financials, and Consumer Discretionary. Consumer Discretionary jumped the most from 13.9% through Q3 to 30.1% to end the year.
- The best performing country in the last six months of 2024 was Israel. It gained 8% through June, then climbed to 38.8% to finish the year.
- The worst performing country in the back half of 2024 goes to Denmark. It gained 24% through June then dropped five of the last six months, ending the year with a 12.6% loss.

Related Reading: