Early value metrics were dependent on information that was easy to find. Price/Earnings and Price/Book came out of that era. Both did a decent job of capturing value’s outperformance.
But as financial statements became more widely available, it spawned other value metrics that performed even better. Cash flow-based value metrics are a good example of this.
The cash flow metrics tested below are built using market cap (enterprise value metrics will be next). All tests were run on the following assumptions:
- No OTC stocks or ADRs.
- No stocks trading below $1/share.
- No low-volume stocks.
- Market cap greater than $50 million.
- Deciles are equal-weighted, as is the Universe.
- Benchmarked against the Russel 3000 total return index (It’s a cap-weighted benchmark. The universe of qualifying stocks is included for a better comparison).
- Stocks are bought on January 1st of each year, held for one year, then sold. Rolling backtests are done at four-week intervals with a similar one-year holding period.
- Assume all metrics are based on trailing twelve months (TTM) unless indicated.
- Data are from 2000 to 2020, sourced from Portfolio123.
For the metrics below, higher is cheaper and lower is more expensive. Each one follows a similar pattern where the cheapest decile outperforms the most expensive by a wide margin. The cheapest decile also outperforms the universe and the benchmark. Though, some do a better job of it than others.
You can approach the results in one of two ways. One way is to eliminate the most expensive decile and invest in what’s left. The alternative is to focus on the cheapest decile — combining it with other metrics should further improve the results.
Click the tables below for easier reading.
Operating Cash Flow/Price
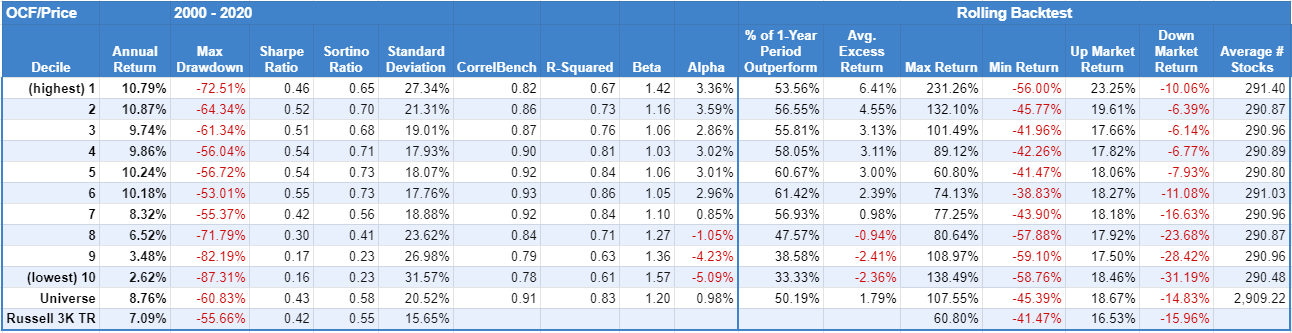 Operating cash flow measures the cash generated from day-to-day business activities. The results show cheapest stocks based on OCF/Price easily outperform the expensive stocks.
Free Cash Flow/Price
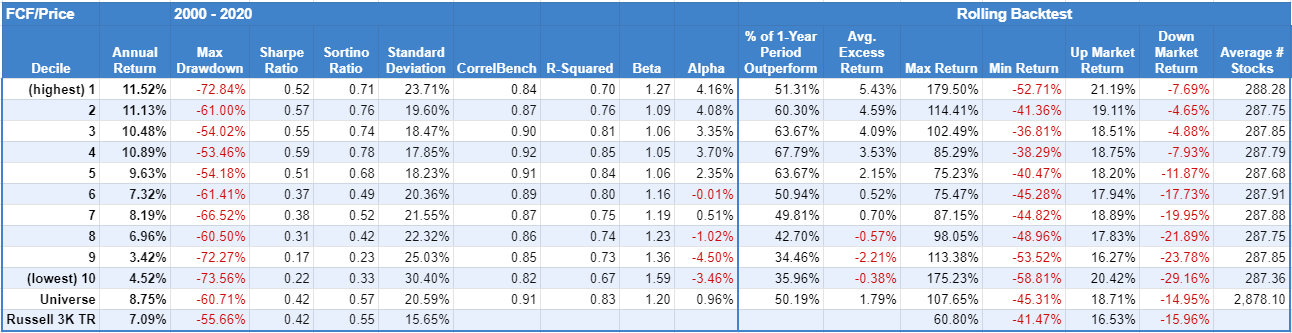 Free cash flow is operating cash flow with CapEx subtracted out. Essentially, it’s the cash available after a company pays its expenses. The “free cash” can then be used by management as it sees fit. Which may or may not be good depending on the management.
The results clearly show the potential benefit of cheaper companies based on FCF/Price.
Net Free Cash Flow/Price
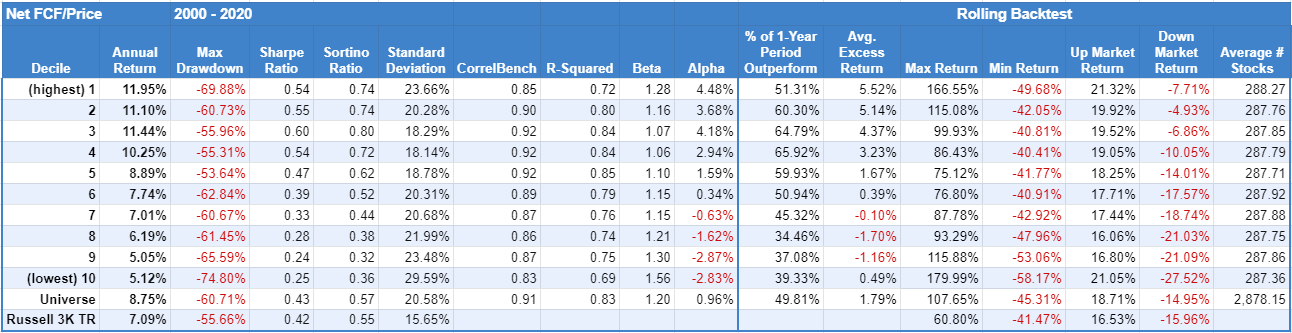 Net Free cash flow is free cash flow with dividend distributions subtracted out. It accounts for dividends paid to shareholders. The results aren’t significantly different from FCF/Price.
Cash Flow/Price
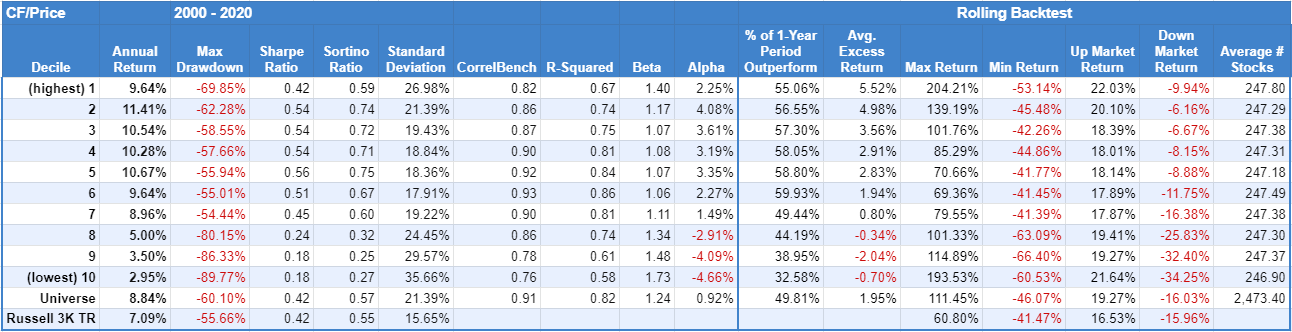 Cash Flow/Price adds depreciation and amortization charges back net income. It’s the only metric in the group to show a drop-off in performance between the cheapest and second-cheapest decile. Beyond that, the results follow a similar pattern to the metrics before it. Cheapest outperforms expensive again.
Operating Cash Flow incl. R&D/Price
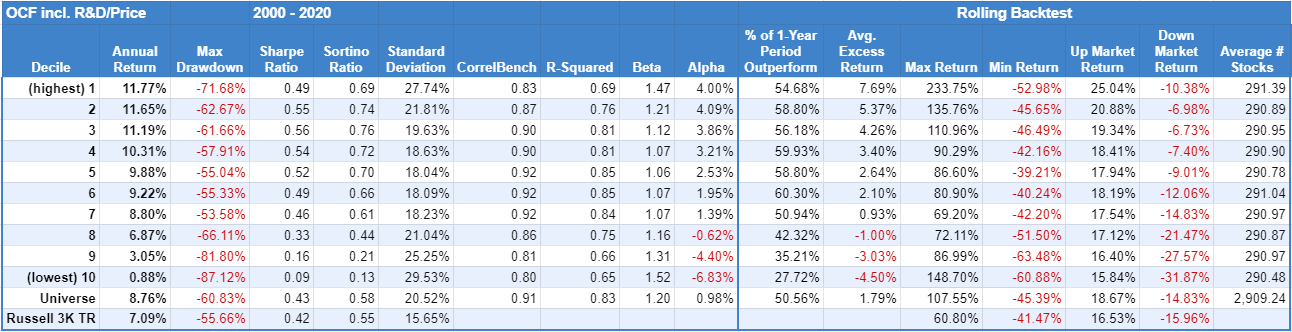 The metric adds R&D expense back to operating cash flow. Though, a significant number of companies don’t spend on R&D, as the next test shows. The results show a slight improvement in returns in the cheapest decile compared to OCF/Price. The biggest difference is on the expensive end, where the most expensive decile performed worse.
Note: When trailing twelve months R&D expense was not available, the most recent annual R&D expense was used.
OCF incl. R&D/Price ex. Companies w/ No R&D
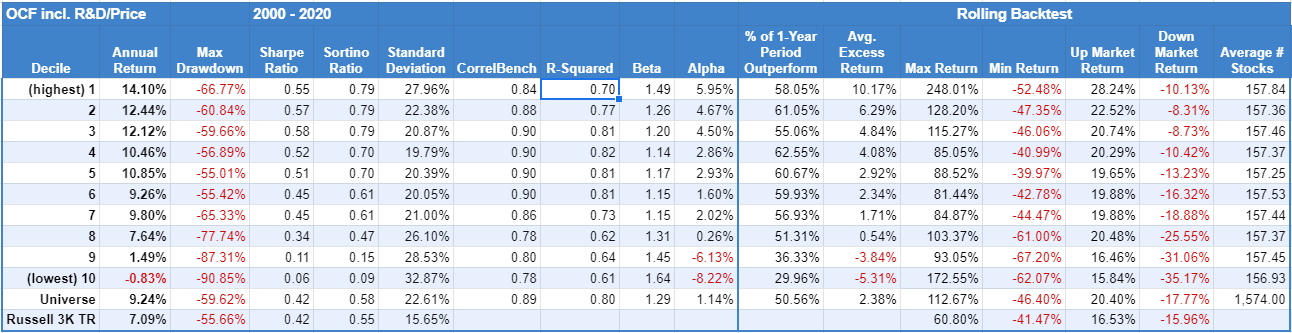 These results were due to a mistake (coded wrong) on my part. It removed all companies without R&D expenses. Thus the Universe shrank to about half the stocks compared to the previous backtest. It’s also concentrated in industries, like tech, reliant on R&D.
My mistake, at least, offers an example of what combining value with a second filter might produce. In this case, the returns of the cheapest decile improved while the most expensive decile produced losses, on average.
Related Reading:
How Classic Value Metrics Performed this Century