Had you bought the S&P 500 on January 1st of any year since 1922, 69.2% of the time you’d have more money one year later. Using the Dow produces the same results: 69.2%.
Both those stats ignore dividends, by the way, which would help improve those numbers.
The idea behind it should set aside the concern of buying at a market top, only to sit at a loss for any number of years. It happens. No amount of market timing will prevent it. And worrying about it, based on those odds, appears to be overrated.
It’s interesting that those numbers don’t change much if you look even further back in time. Which is exactly what Edgar Lawrence Smith did:
We have found that there is a force at work in our common stock holdings which tends toward increasing their principal value in terms of dollars, a force resulting from the profitable reinvestment, by the companies involved, of their undistributed earnings.
We have found that unless we have had the extreme misfortune to invest at the very peak of a noteworthy rise, those periods in which the average market value of our holdings remains less than the amount we paid for them are of comparatively short duration, and that even if we have bought at the very peak, there is definitely to be expected a period in which we may recover as many dollars as we have invested. Our hazard even in such extreme cases appears to be that of time alone.
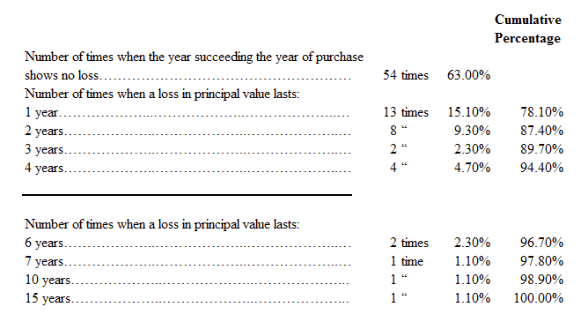
In an attempt to measure the probability of this time element working against us, we have assumed the purchase of the holdings…at the average market price each year from 1837 to 1922…and have asked ourselves for how many years immediately following the year of purchase these holdings would have shown a lower average market value than the price paid. There are 86 such years of assumed purchase (omitting 1923), and the results of our analysis of this time hazard may be summarized as follows:
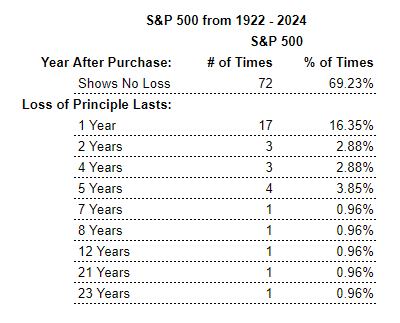
Here’s the S&P 500 since 1922:
And the Dow since 1922:
There are a few things to keep in mind:
The 1800s stock market was dominated by railroads and utilities, with a few industrial companies scattered in by region. Sector concentration in the U.S. increases the further back in time you go.
Smith’s earlier period contains the same ten stocks, made up of railroads, utilities, and industrials — cotton mills to be exact — found on the Boston Stock Exchange.
Whereas the Dow (30 stocks) and S&P (50 initially, later 500) is more flexible, rotating stocks in and out of the basket.
Smith used the average stock price for the year. The S&P and Dow data use the price at the start of the year.
Buying the ’29 peak was the worst, as expected, taking over two decades before seeing a gain. 1930 was the second-worst buying opportunity. 1847 was third worst with a 15-year wait.
Those dates hint at what led to periods of multi-year losses before a profit was realized. 2008, 2000, 1973, 1946, 1937, and 1929 — five times in the past 100 years. Markets take longer to recover from years that hit peaks of extreme excess and panic.
Dividends are not reinvested or factor into the results of either time period. Obviously, including dividends shortens the time back to break even. Reinvesting dividends shortens it further.
It ignores any attempt to take price and valuation (or other strategies) into consideration to improve the odds.
So, it’s not an apples-to-apples comparison. Nor would I put a ton of weight on the earlier time period when making decisions about markets today. But I found the similarities interesting none the less.
Most of the time, investors are more likely to experience market gains than losses one year after buying a basket of stocks. And the losses usually correct themselves within a year or two.
But not always.
You can expect losses. Sometimes those losses will take longer than you’d like to get back to even. A drastically longer period in your lifetime is possible. In fact, you should plan for it, just in case.
Data updated through 2024. This post was originally published on October 11, 2019.