Hype around IPOs is nothing new. You can go back to the 1700s, during the South Sea Bubble, to see it play out.
All it took was a company with wonderous possibilities, a chance to get rich, and a public eager to buy. The booming bull market helped set the stage for crazier offerings. And it worked.
The craziest by far was not the company trying to extract silver from lead or trade in human hair or build a perpetual motion wheel but for “a subscription advertised, and actually opened, for an undertaking, which shall in due time be revealed.” Just think of the possibilities!
The Dotcom Bubble is a more recent, perfect, example of the craziness. In 1999 alone, there were 478 IPOs. Almost 80% percent were tech stocks. Over 70% had no earnings. It didn’t matter.
The average first-day return for IPOs in 1999 was 71%! The environment was perfect. Public enthusiasm was at its peak, the internet brought infinite possibilities, and the stocks brought a chance for instant wealth. And the first-day pop was manufactured.
By 1999 investment banks had the IPO game figured out. They knew what it took to deliver a big opening day and the attention that came with it. A low initial float i.e. a limited supply of shares available to trade, an attractive offering price, and eager buyers almost assured a higher price the first day.
It worked too well. Three years later almost all those IPOs lost money after the bubble burst.
The pattern of large first-day pops, yet poor long-term performance is not unique to the Dotcom Bubble. It’s normal. Data from Jay Ritter’s IPO Statistics (linked below), going back to 1975, shows how common it is.
The chart below shows the number of IPOs per month against the S&P 500 performance from 1980 to 2001.
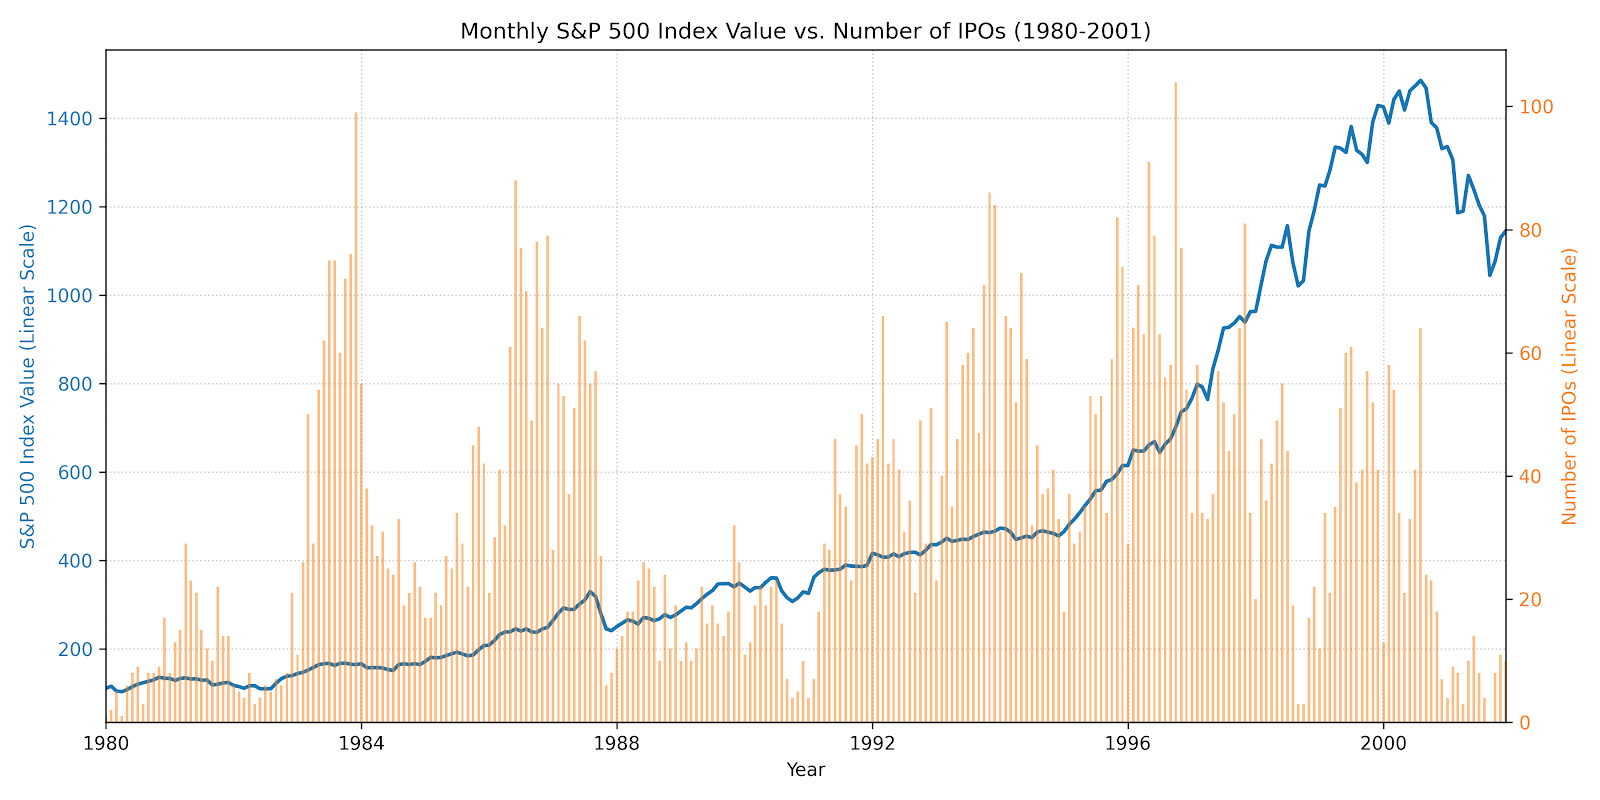
The 1980s and 1990s were awash in IPOs. The entire two decades averaged about 35 IPOs per month. October 1996 saw the most IPOs at 104. In fact, 1996 saw more IPOs than any other year during that two-decade span.
The next chart shows the number of IPOs per month against the S&P 500 performance from 2001 to 2025.
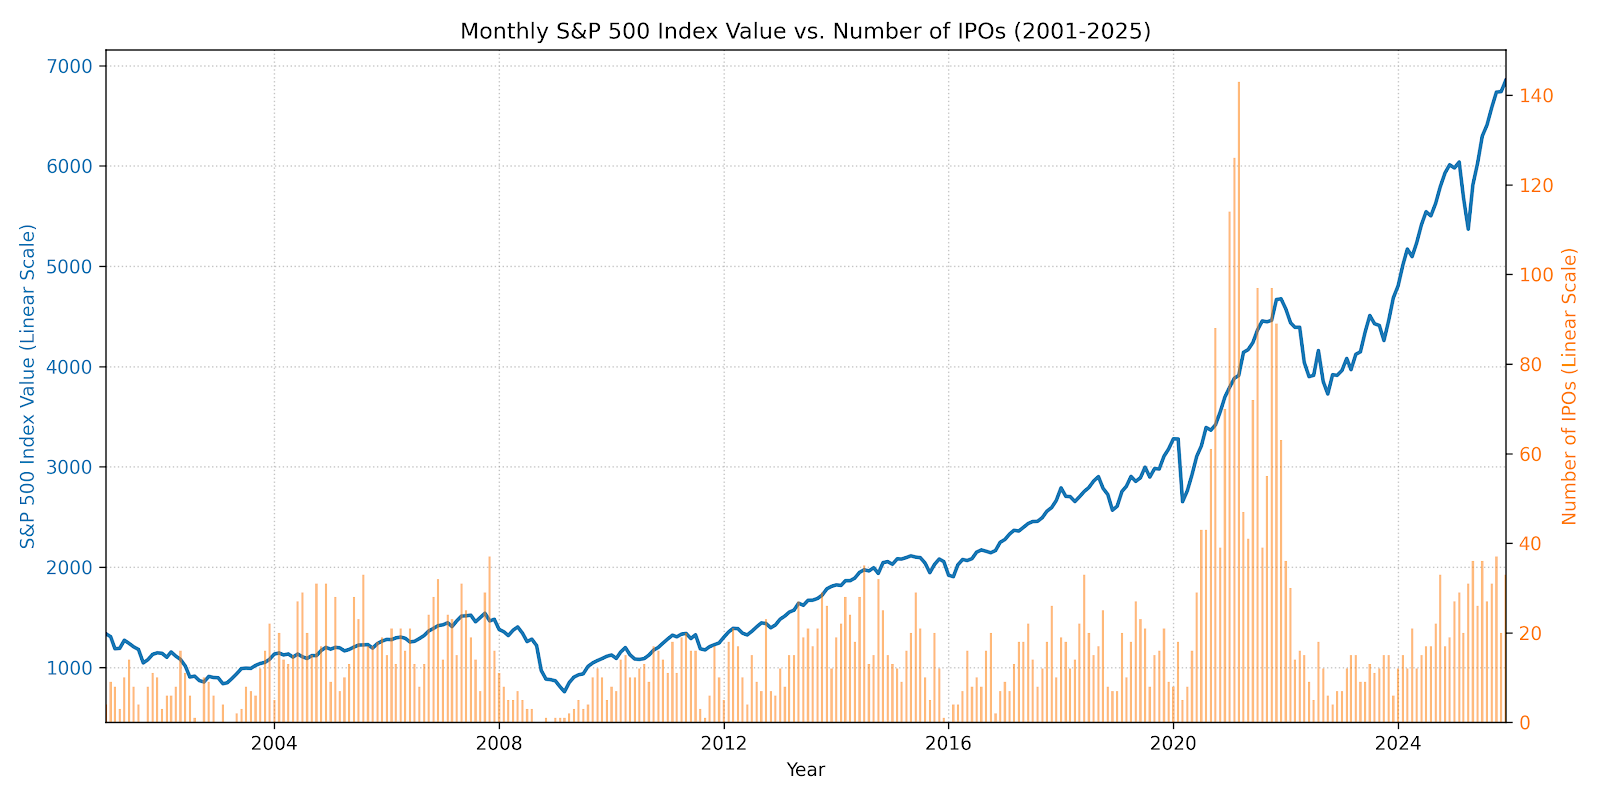
One thing stands out. The number of IPOs per month is significantly less than the 1980 to 2001 period. The lone exception was the 2020 to 2021 SPAC craze that deflated by 2022.
At its peak, over 100 IPOs occurred in the months of January, February, and March 2021 alone, with over 900 on the year. Almost 70% were SPACs.
You also may have noticed a pattern in the two charts around market drawdowns. The number of IPOs fall after the market falls. It’s most apparent around the 1987 Crash, the Dotcom Crash, the Great Financial Crisis, and the 2022 bear market. However, it’s not limited to major market shocks.
Turns out it doesn’t take much of a market decline to reduce the number of IPOs as the chart below shows.
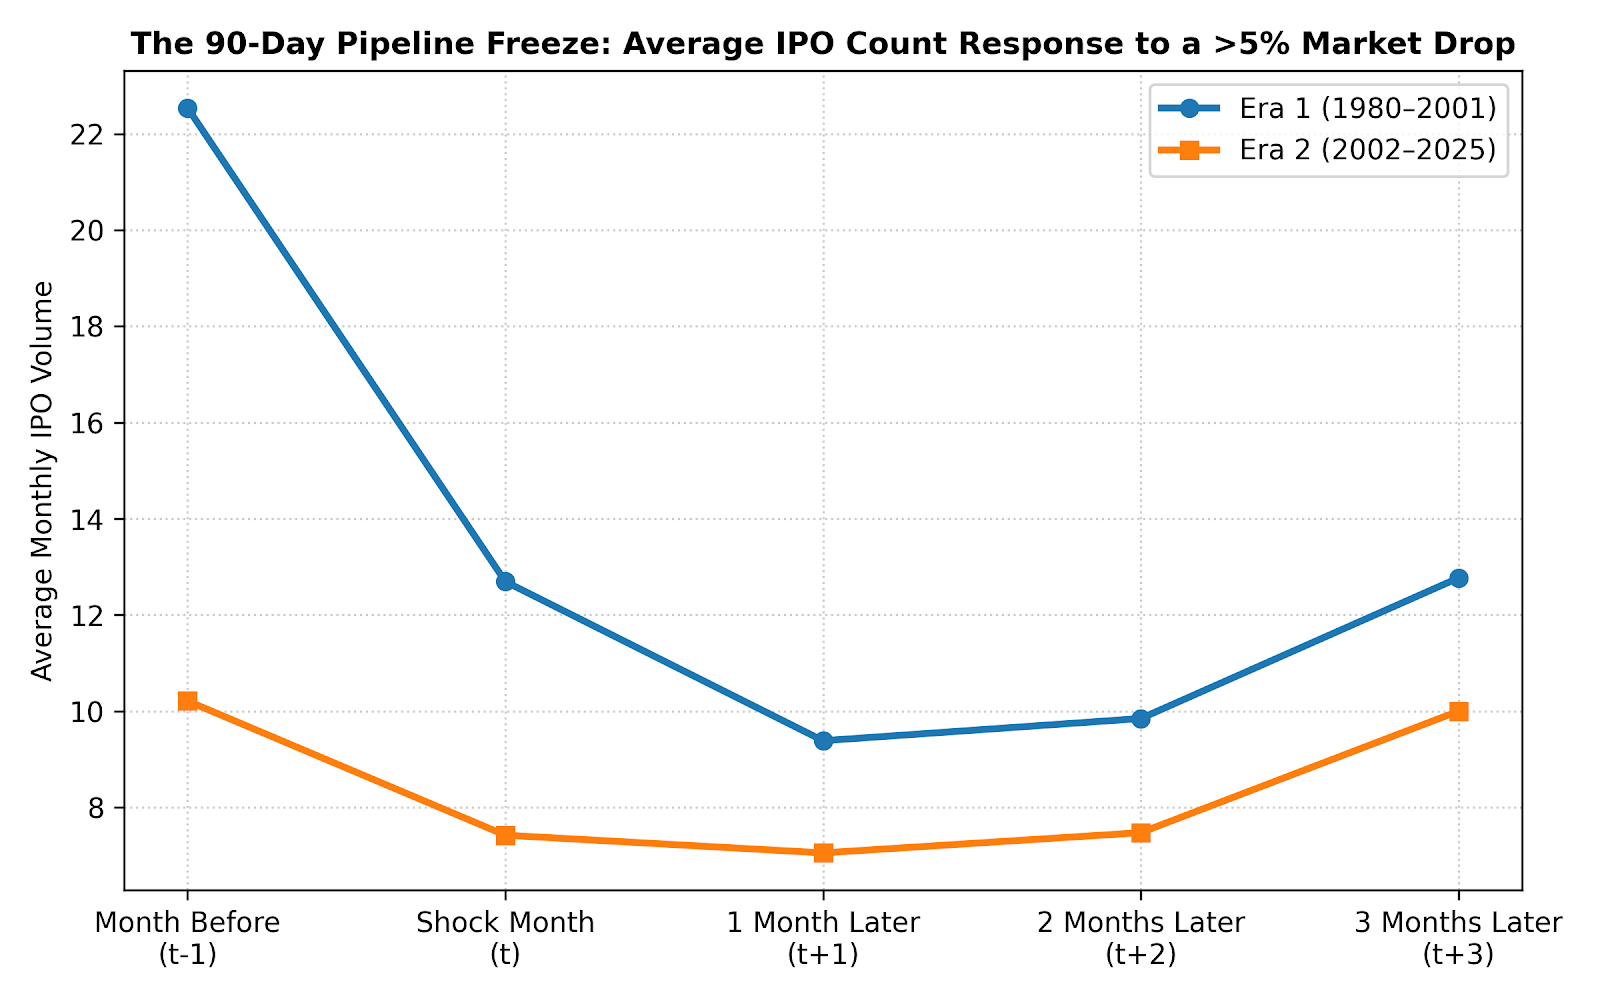
The number of IPOs drop, on average, whenever there’s a month over month market decline of 5% or more. The number of IPOs drop by about half from the month before the market declined to the month after the decline.
It’s almost as if investment banks know that rising markets breed confidence and more confidence leads to more investor interest in IPOs. Pausing new IPOs after a decline, only to spin them up again after the market recovers, works in their favor.
Performance data are broken down by return from the offer price and return from the closing price on the first day of trading. It separates the few who had access to buy at the IPO price from everyone else who could only buy after the stock started trading publicly.
The table below shows the average first-day return and the 3-year buy-and-hold return for both over the entire 1980 to 2024 period.
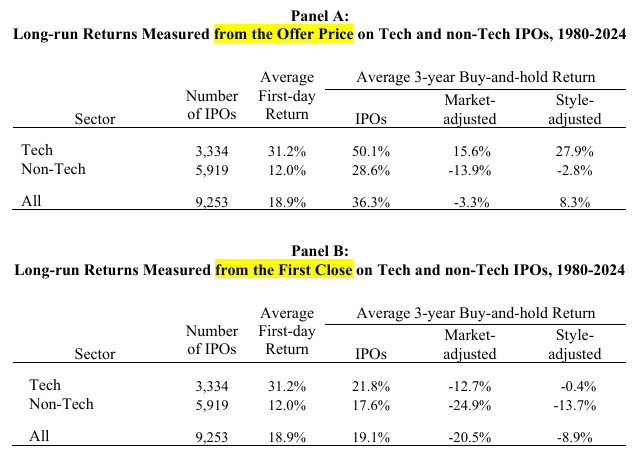
As shown, the average first-day pop for all IPOs was 18.9%. Tech company IPOs were significantly higher than non-tech IPOs. Having access to IPOs, at the offering price, has advantages.
A stark difference shows up in the 3-year performance. Across all IPOs, the average IPO underperformed the market over its first three years. The underperformance was worse, on average, for those without access to the IPO price than for those with access but both underperformed.
However, the underperformance disappears for tech stocks bought at the IPO price but persists when bought at the first day closing price.
Digging deeper, the buy-and-hold return over three and five years, shown below, shows the disparity of IPO performance over longer periods.
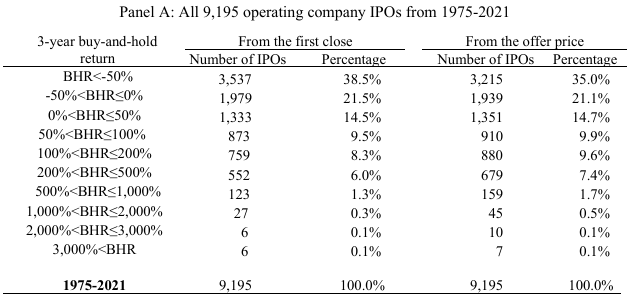

Again, the table separates performance based on when the IPO was bought — at the offer price or the first day closing price.
56% of IPOs bought at the offer price lost money after 3 years. That number rises to 57% after five years. The numbers are higher when bought at the first day closing price: 60% lost money after 3 and 5 years. Worse than a coin flip.
Only 19% of IPOs doubled or more after three years and 22% after 5 years when bought at the offering price. The numbers were worse when bought at the closing price.
Of course, the lottery-like returns were possible, but it amounted to about 0.4% of all IPOs after 3 years and 1% after five years.
We can draw a few general conclusions from the bulk of the IPO data:
- The first-day pop is real. IPOs are designed to pop. A limited supply of shares, attractive offering price, and high demand from eager buyers raises the odds of a higher closing price on the first day of trading.
- The first day pop is not guaranteed. You still have to pick the right IPOs because the hit rate on first-day gains, while high, is not 100%.
- Eager buyers are a key ingredient. The number of offerings drop off on the slightest market pullbacks likely to reduce the chance skittish investors avoid the IPO and hurt demand. High demand is required to generate a higher closing price.
- Access is required. To profit off the first day pop, you need access. Yet, most investors will never have access to the offering price, left to buy in the open the market, after the pop.
- IPOs underperform the market. The market outperforms the average IPO over 3 and 5 years.
- Most IPOs lose money long term. Over half of all IPOs lose money over the first 3 and 5 years.
Your success with IPOs depends on one important thing. Do you have access? The answer is no for almost everyone.
It turns out, you’re almost always better off waiting to buy a stock months to years after the IPO or not at all. A heavy emphasis belongs on not at all.
Of course, waiting has benefits. You learn more about the company’s trajectory. You have a good chance to buy at a better price. And while you wait, just own a market index fund. IPO underperformance favors it. And who knows, maybe the company proves the exception, gets added to the index, and you end up owning it in the end.
Source:
Related Reading: