The 10 largest U.S. companies now account for roughly 39% of the S&P 500. These companies are big for a reason. Most are growing high margin businesses. They trade at a premium relative to a typical company because they’re viewed as high quality.

The Dotcom Bubble’s insane P/E multiples can be seen on the left. The biggest companies barely had earnings back then. Everything was priced on hope.
Today’s top 10 companies have traded at a premium to the broader S&P 500 over the last ten years because most have shown to be high quality cash cows. Companies with higher profit margins and higher growth rates over extended periods than the typical S&P 500 company deserve a premium price.
But a further dislocation began around 2023 (the original ChatGPT announcement was November 2022 — start of the AI boom). Since then, the 10 largest companies have maintained a median P/E above 30, ranging as high as 46, with an average closer to 35. Compare that to the broader S&P 500 which has never exceeded a median P/E of 27 in the same time period and averaged about 25.
Keep in mind, within today’s top 10 sit Berkshire Hathaway and JPMorgan Chase. If you remove those two and just focus on the 8 tech companies, you get a similar low range of 30 but a higher range of 61 (reached in July 2023). Today, the biggest 8 companies have a median P/E of 36.
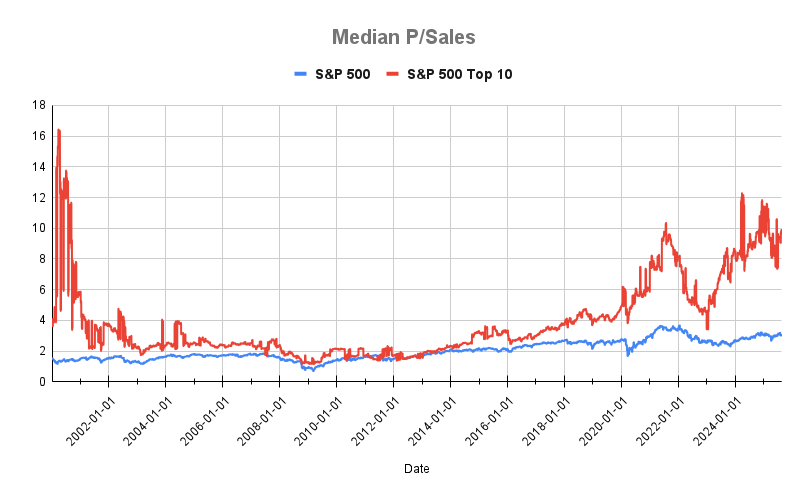
The dislocation in the top 10 is more apparent when measured by median Price/Sales. Again, the 10 largest companies at the peak of the Dotcom Bubble traded almost 12x higher than the average S&P 500 company based P/Sales. The craziness from the Covid Pandemic is the next big spike in 2021 that topped out near 10x sales.
Since 2023, the top 10 companies have averaged a median P/S of 8.4, compared to 2.8 for the broader S&P 500. Today, the 10 largest companies trade at 9.6x sales, three times higher than the S&P 500 at 3.1x sales. The top 8 companies, push that number to 11.9x sales.

It’s no surprise that the 10 largest companies are more concentrated in the S&P when you look at the first two charts above.
Already large companies that see their multiples grow at a faster rate than the broader index during a bull market, see their market cap grow at a faster rate, and become a larger part of the index.
But rising valuation multiples are not always good news for a few reasons:
- Not all companies that trade at a premium are high quality. High priced is often mistaken for high quality.
- Some companies that trade at a premium are priced for perfection. Everything has to go right, long term. They’re one slip up away from being repriced lower and investors losing money.
- A few quality companies that trade at a premium are actually underpriced. The market fails to recognize their true growth potential.
- Not all quality companies, retain that standing long term. They get disrupted. They mature. New, faster growing companies come along. History has shown a lot of turnover in the biggest companies over time.
Picking long-term winners is hard for all the reasons above. It gets harder when it’s around a potentially transformative innovation (see the Dotcom bubble).
Of course, these charts never tell us if we’re closer to the beginning or end of a bull market run either. So, if these charts make you squeamish, here are a few options to consider:
- Freak out, sell everything, and hope for a crash. (Not recommended.)
- Rebalance your portfolio, if you haven’t done so in a while.
- Take a little off the table. Reduce your U.S. large cap allocation a bit (not to zero) and move money towards lower valuation equities like small caps, international stocks, and/or bonds.
- Do nothing.
If you’re broadly diversified, you’ve benefitted from the rise of these companies, but you don’t have all your money in large cap stocks either. In fact, you probably have more money allocated across other asset classes. So, you’ve already taken steps to diversify this risk in large caps. But if it still turns your stomach, take a little off the table. Investing is as much about comfort as anything else.
Related Reading: