Midway through the year, I update the different asset tables with first-half returns. It’s July, so time for an update.
Before I begin, here’s a quick reminder. The tables are meant to offer basic lessons on diversification, market cycles, and mean reversion.
The only other constant beyond that is the lack of consistency from one year to the next. In time, best performers become worst performers – expensive becomes cheap – and vice versa. And the benefit of middling is apparent. A diversified portfolio forsakes the best returns in order to avoid the worst.
Click the images to see the full-sized table.

Last year’s rate hike worries drove assets with yields – bonds and REITs – lower. With the rate hike out of the way, the chase for yield was back on. That explains some of the high-yield and high-grade bond performance so far this year. A move toward safety would cover the rest. Though, high-yield (junk) bonds don’t denote safety, investors still want yield in this the low rate environment (in this case, might be confusing any yield for safety).
REITs saw the biggest boost for the year, possibly from yield chasing. The other possibility is investors anticipating the upcoming change to the S&P sector breakdown. Seth Klarman calls it the mindless action that exists whenever an index changes. In this case, it’s so much the index changing as a sector being split in two.
Two years ago, S&P decided to add an eleventh sector – real estate – that goes into effect in September of 2016. In the past, real estate stocks (including REITs) were lumped into the financial sector. Going forward, real estate stocks – the exception being mortgage REITs – will move into the new S&P real estate sector. Any index funds based on financials, new real estate index funds, and active fund copycats will be involved in this mindless buying and selling.
Based on CAPE ratio, emerging markets have been cheap for a while now, so it’s nice to see some signs of life after three consecutive losing years.
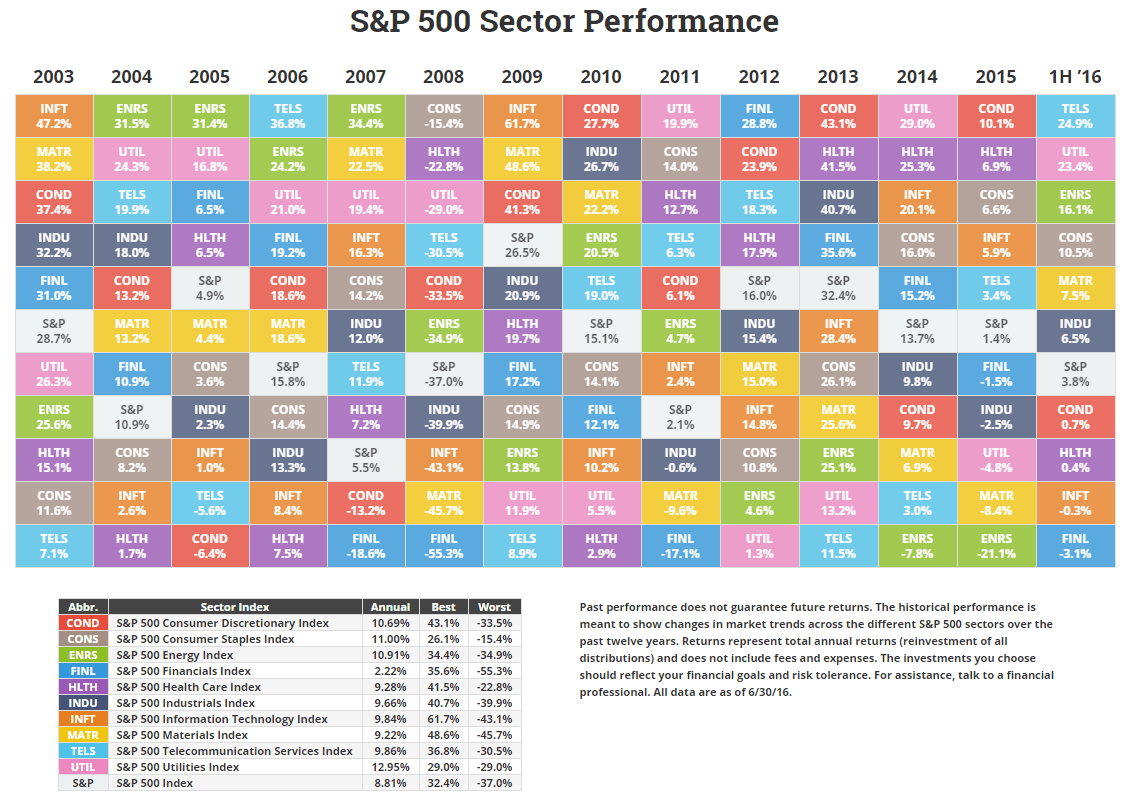
The sector table gives a bit more insight into what is driving the S&P 500. Telecoms and Utilities turned in a great first half performance of 25% and 23% respectively. The performance for both fit my chase for yield and safety theory. Yet, because both make up only about 3% of the total S&P 500, the overall impact was minimal.
Energy was the cheapest sector to start year. To some, it might be the most surprising performance base on all the negativity the last year.
By the way, energy still is the cheapest with a current P/E of 12.5, followed by financials with a current P/E of 16.6. The most expensive sector is consumer discretionary with a current P/E of 36.9, followed by healthcare at 28.6.
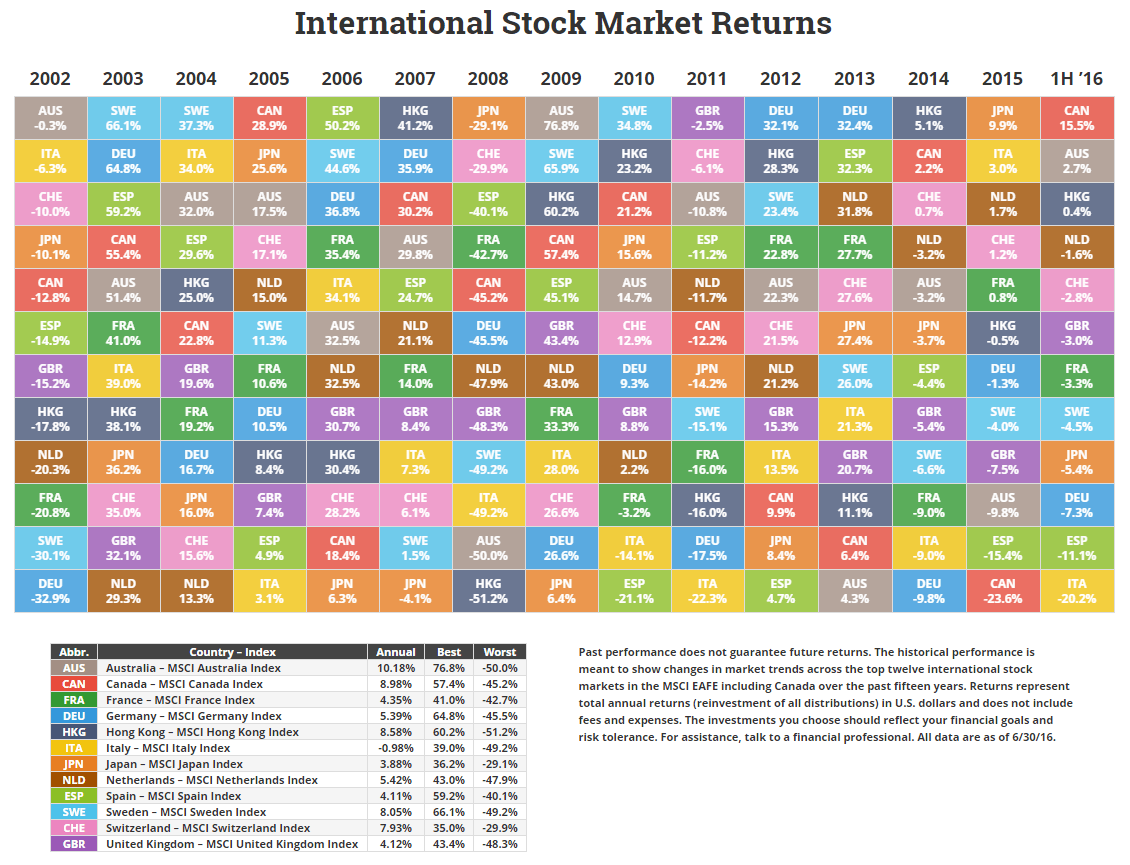
The international table only shows the twelve (of the 22) largest developed markets ex. U.S. Only one actually performed better than those shown – New Zealand had an 18.6% return over the past six months. Italy was the worst of the worst with a 20.2% loss. Most of the European markets were in the red. I’m sure the recent Brexit fallout played a big role.
The losses made already cheap markets, cheaper. Portugal, Italy, Spain, Austria, and Norway are currently the five cheapest by CAPE ratio, in that order.
Denmark, Switzerland, Ireland, Belgium, and Sweden are currently the most expensive by CAPE ratio, in that order (the U.S. would fit snuggly in 2nd if included).

The emerging market table shows the twelve (of the 23) largest emerging markets. Peru (not shown) actually topped Brazil with a 50.1% return in the last six months. The worst performer was Greece (also not shown) with a 24.4% loss.
The biggest standout is a lesson in combining cheap markets and patience. Brazil and Russia have been two of the cheapest markets by CAPE ratio for several years. Both certainly fell in the unloved camp. Brazil had 3 consecutive losing years and political turmoil. Russia’s been dealing with the combined effects of sanctions and low oil prices. So far this year, patience and a little pain have paid off.
Yet, Brazil and Russia are still cheap. Russia, Czech Republic, Poland, Brazil, and Egypt are the five cheapest markets by CAPE ratio, in the order. Philippines, Mexico, India, South Africa, and Indonesia are the five most expensive by CAPE ratio, in that order.
Tables
- Asset Class Returns
- S&P 500 Sector Returns
- International Stock Market Returns
- Emerging Stock Market Returns
And if you want a copy of one of the images above, you can get it here.