Equal weighted fund strategies are the laziest form of active indexing. When you put the least amount of thought into changing an index, the lazy solution is to give every stock an equal say. However, the results show equal weighted funds outperform your vanilla cap weighted funds.
That outperformance is accidental.
Luck would have it that by equal weighting every stock, you accidentally tilt toward factor premiums, like value, momentum, volatility, or size, which can add to long-term performance. I cover this in the smart beta guide. If you weighted stocks alphabetically you’d see similar results. Then the fund industry could charge a premium for ALPHA-bet funds instead.
With international funds, an equal weighting adds risk. I suspect this is one reason the equal weighted MSCI EAFE fund didn’t last long. The side effect of equal weighting international, emerging market, or global funds, is increased country risk.
When the size of the companies don’t matter, the number of stocks from any one country can cause problems. The country with the most stocks in the index makes up the biggest piece of the index, has the biggest impact on performance, and brings with it the most risk.
You’re left with two options: stick with the vanilla international index fund, which has a solid performance history behind it, or find something better.
The next best solution might be to equal weight the countries. It’s not perfect, but anyone who thinks the smaller countries don’t get a fair shake might disagree.
In keeping with the lazy theme, and out of curiosity, I thought I’d build a custom international fund equally weighted by country, then compare it to the cap weighted and equal weighted version of the MSCI EAFE index.
To do this with the MSCI EAFE is fairly easy. All you need is a spreadsheet, historical returns for each country, and the dates new countries were added to the index. Since each country gets an equal share, the math is so easy even I can do it.
What you get is a hybrid of equal weighted countries with cap weighted performance from each. This way, you’d keep the few advantages of cap weighted indexes, less turnover and lower cost, with an equal amount of country risk. Or, at least, that’s my theory.
Current Breakdown By Country
MSCI doesn’t share the full details of its index. Based on the charts below, you can see how the current cap weighted and equal weighted MSCI EAFE index is sliced up by country.
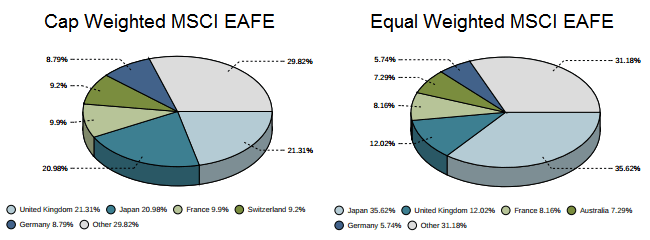
In both cases, the U.K. and Japan make up a big piece of the total performance, with the top five being about 70% of the index. By equal weighting the index, Japan’s portion gets reshuffled higher and the U.K. drops to 12%.
The “Other” category is the remaining sixteen countries not shown. This is the concern. Those “Other” countries each make up a sliver, about 2% or less, of the total pie. A great performing sliver doesn’t carry much weight in the index.
Predicting the best performing country year after year is difficult. MSCI makes its prediction based on the size of a country’s equity market. But is the size of a country’s stock market the best way to weight your portfolio? A bigger market doesn’t equate to a better performing market each year. Japan’s lost decade can attest to that.
You get a lot of country specific risk for what is supposed to be a diversified international fund.
What if I want the best chance of capturing the best performing country every year or spread the country risk more evenly? An equal weighting by country would only give each country a 4.76% share of the index, but would give me an equal chance of being right every time.
Cap Weighted vs Equal Weighted vs. Equal Weighting by Country
The table below compares the annualized returns (with dividends included) of each index weighting from 1974 to 2013.
| MSCI EAFE Weighting Comparison | ||
| Cap Weighted | Equal Weighted | Equal Weighting Countries |
| 10.18% | 11.53% | 11.93% |
A table with the yearly returns since 1974 is at the bottom of this page.
No surprise that the equal weighted index outperformed its cap weighted counterpart. However, I was surprised that the weighting by country didn’t produce better results. Not that almost 12% is terrible. To see exactly how each stands up over time, the chart below shows the growth of $10,000 since 1974.
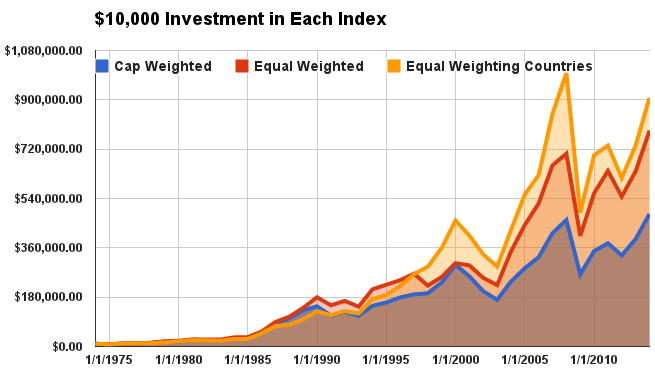
Given enough time, an extra 1% or 2% return can do a lot for your money. The final tally looks like this:
- Cap Weighted = $483,386.25
- Equal Weighted = $787,368.62
- Equal Weighting Countries = $907,937.22
The last two make a good argument for the lazy, equal weighted approach to international index funds. It’s easy to gravitate toward those big hypothetical results.
Before you try to replicate this or start replacing index funds with their equal weight counterparts, make sure you understand the risks first. Then make sure the costs are worth it.
By lowering the risk to any one country, there’s a good chance you’re taking a higher risk somewhere else. The bigger swings that come with that risk might be enough to scare you out of the fund at the worst possible time.
For equal weighting by country, it’s a case of building a different mousetrap, not necessarily a better one. Good thing only one of these international index funds exist now.
Yearly Breakdown Since ’74
The first full year of equal weighted MSCI EAFE data starts in 1974, which was used as the starting point for all comparisons.
| MSCI EAFE Weighting Comparison | |||
| Year | Cap Weighted | Equal Weighted | Equal Weighting Countries |
| 1974 | -22.15% | -20.79% | -19.91% |
| 1975 | 37.10% | 44.68% | 35.07% |
| 1976 | 3.74% | 0.52% | 3.93% |
| 1977 | 19.42% | 18.76% | 4.78% |
| 1978 | 34.30% | 40.20% | 27.11% |
| 1979 | 6.18% | 9.25% | 29.19% |
| 1980 | 24.43% | 24.22% | 20.62% |
| 1981 | -1.03% | -0.49% | -3.73% |
| 1982 | -0.86% | -2.97% | -6.26% |
| 1983 | 24.61% | 32.24% | 29.22% |
| 1984 | 7.86% | 3.08% | 2.20% |
| 1985 | 56.72% | 60.06% | 73.32% |
| 1986 | 69.94% | 63.22% | 54.94% |
| 1987 | 24.93% | 21.62% | 6.28% |
| 1988 | 28.59% | 29.49% | 25.30% |
| 1989 | 10.80% | 27.40% | 29.29% |
| 1990 | -23.20% | -16.29% | -11.17% |
| 1991 | 12.50% | 10.66% | 13.21% |
| 1992 | -11.85% | -12.52% | -6.85% |
| 1993 | 32.94% | 43.47% | 43.98% |
| 1994 | 8.06% | 7.86% | 8.29% |
| 1995 | 11.55% | 7.42% | 17.62% |
| 1996 | 6.36% | 9.83% | 19.54% |
| 1997 | 2.06% | -16.45% | 10.41% |
| 1998 | 20.33% | 14.48% | 23.31% |
| 1999 | 27.30% | 19.62% | 27.90% |
| 2000 | -13.96% | -2.63% | -11.96% |
| 2001 | -21.21% | -15.40% | -16.99% |
| 2002 | -15.66% | -10.57% | -13.21% |
| 2003 | 39.17% | 54.84% | 45.72% |
| 2004 | 20.70% | 27.94% | 30.62% |
| 2005 | 14.02% | 17.66% | 12.68% |
| 2006 | 26.86% | 26.61% | 35.66% |
| 2007 | 11.63% | 6.49% | 17.69% |
| 2008 | -43.06% | -42.61% | -51.12% |
| 2009 | 32.46% | 38.46% | 42.98% |
| 2010 | 8.21% | 14.61% | 5.09% |
| 2011 | -11.73% | -14.63% | -16.11% |
| 2012 | 17.90% | 16.91% | 19.26% |
| 2013 | 23.29% | 23.10% | 23.74% |
| Annualized Return | 10.18% | 11.53% | 11.93% |