For decades, a company’s market cap was used in valuation ratios but it has a fatal flaw. It can be misleading for companies with piles of debt. So enterprise value emerged as an alternative.
The advantage of enterprise value is that it’s a closer approximation of what a business might cost if it was bought outright. When you buy a business, you get everything — the business, its assets, and its debts. So enterprise value includes the company’s market cap, plus its outstanding debts (including preferred stock), then subtracts out the cash.
Including debt can dramatically change the valuation of a company. A company might look cheap based on market cap alone. But if it’s sitting on piles of debt, it will look expensive based on enterprise value. It’s not perfect, but using enterprise value makes for a better comparison between different companies.
The value metrics below are built using enterprise value. All tests were run with the following setup:
- No OTC stocks or ADRs.
- No stocks trading below $1/share.
- No low-volume stocks.
- Market cap greater than $50 million.
- Deciles are equal-weighted, as is the Universe.
- Benchmarked against the Russel 3000 total return index (It’s cap-weighted. The universe of qualifying stocks is included for a better comparison).
- Stocks are bought on January 1st of each year, held for one year, then sold. Rolling backtests are done at four-week intervals with a similar one-year holding period.
- Metrics are based on trailing twelve months (TTM) unless indicated.
- Data are from 2000 to 2020, sourced from Portfolio123.
For the metrics below, higher is cheaper. Lower is more expensive. Each follows a similar pattern where the cheapest decile handily outperforms the most expensive decile.
That said, in only one instance the cheapest decile was the best performing decile. The likely reason is that some of the cheapest stocks deserve to be cheap and drag down the performance. So if you’re hunting for the cheapest stocks, take extra steps to eliminate the deservedly cheap to improve performance. The alternate approach is to remove the most expensive stocks and invest in the rest.
Click the tables below for easier reading.
Sales/EV

The argument goes that EV/Sales is a better measure than Price/Sales because both sales and EV take debt and equity into consideration. That said, the performance of the two ratios is fairly similar. Cheap outperforms expensive and the universe. Though, EV/Sales has a slight edge over Price/Sales in the cheapest decile.
Gross Profit/EV
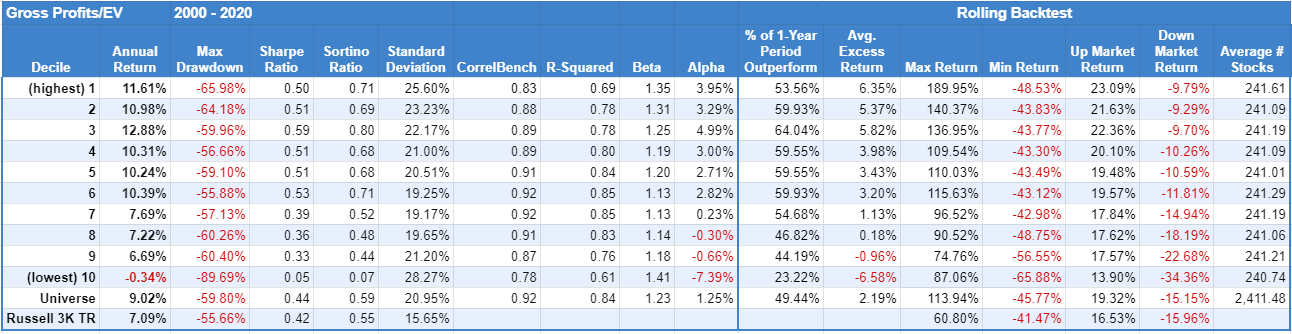
Gross profit is earnings minus the cost of goods sold. It measures a company’s ability to produce things efficiently. The cheapest GP/EV companies perform best. More telling is that the most expensive (the lowest) GP/EV companies are net losers, on average.
EBIT/EV
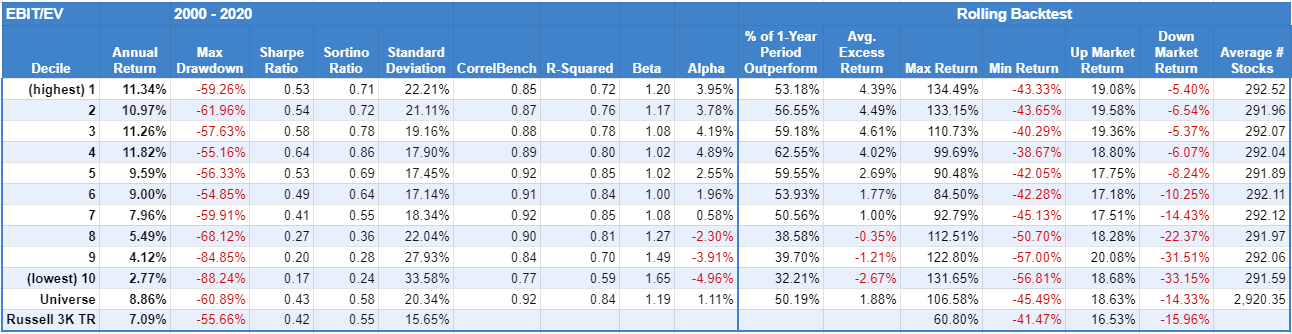
EBIT is earnings before interest and taxes. The theory with EBIT/EV is that it’s easier to compare companies after being normalized for interest and taxes. Not everyone agrees, obviously, but the pattern still holds. Cheap outperforms expensive again.
EBITDA/EV

EBITDA takes EBIT a step further with earnings before interest, taxes, depreciation, and amortization. EBITDA has its critics too, and rightly so. Taking earnings before everything can make the most unprofitable company look great. In other words, it’s easy to manipulate.
But the pattern of outperformance still stands. The cheapest outperforms the most expensive. That said, there is a notable dropoff in performance from the second cheapest to the cheapest decile.
Operating Earnings/EV
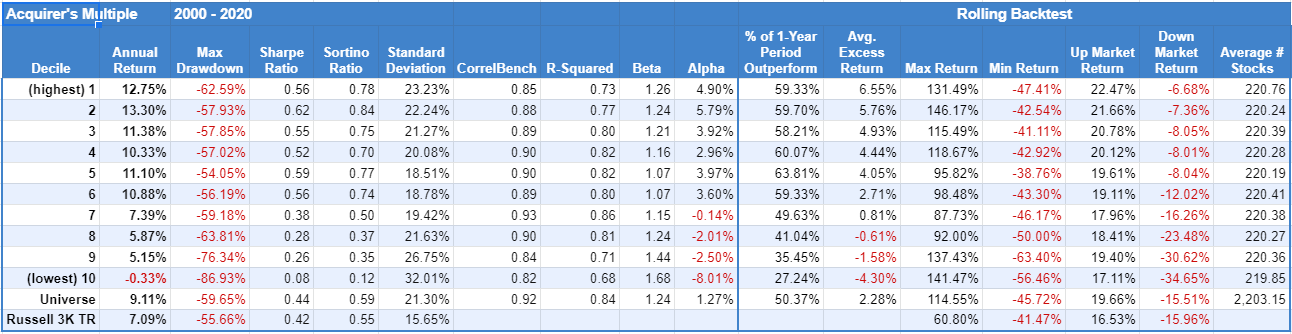
Operating earnings to EV was written up in the book The Acquirer’s Multiple (also goes by the same name). Operating earnings start with revenue, then subtracts the cost of goods sold, general and admin costs, depreciation, and amortization. This avoids one-off extraordinary items or expenses that can inflate/deflate earnings.
It’s one of the better-performing metrics. Again, cheap beats expensive but with the most expensive stocks being net losers, on average.
Operating Cash Flow/EV

Operating cash flow is the money made from everyday business operations. The cheapest OCF/EV stocks beat the most expensive but the second-cheapest decile performs even better.
Operating Cash Flow incl. R&D/EV

The metric adds R&D expense back to operating cash flow. R&D allows companies to compete and grow. So the theory is that R&D is a net benefit to the existence of most companies. But its performance might be skewed by the fact that R&D tends to be more prevalent in certain industries.
Like the OCF/EV, cheap outperforms expensive. More importantly, the drop between the first and second-cheapest decile is gone.
Free Cash Flow/EV
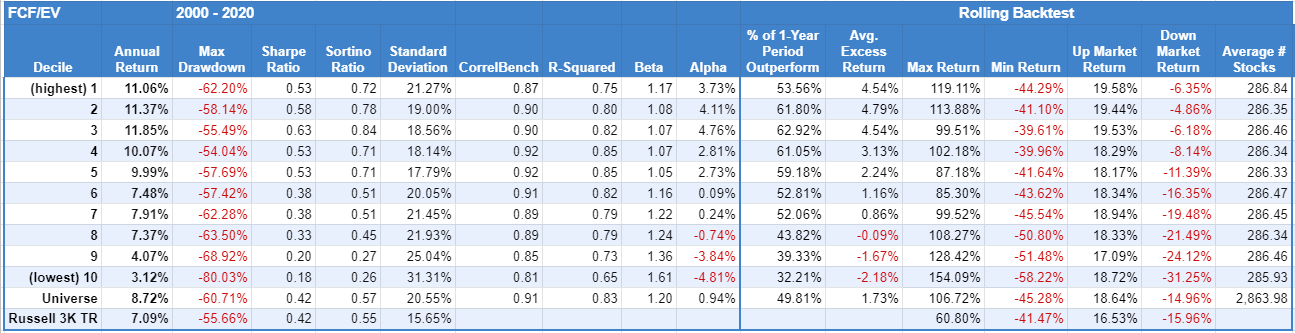
Free cash flow is the money available after a company pays its expenses (operating cash flow minus CapEx). So more is better. It’s “free cash” for management to play with, pay dividends, or buy back stock. And once again, the cheapest FCF/EV stocks outperform the most expensive.
Net Free Cash Flow/EV
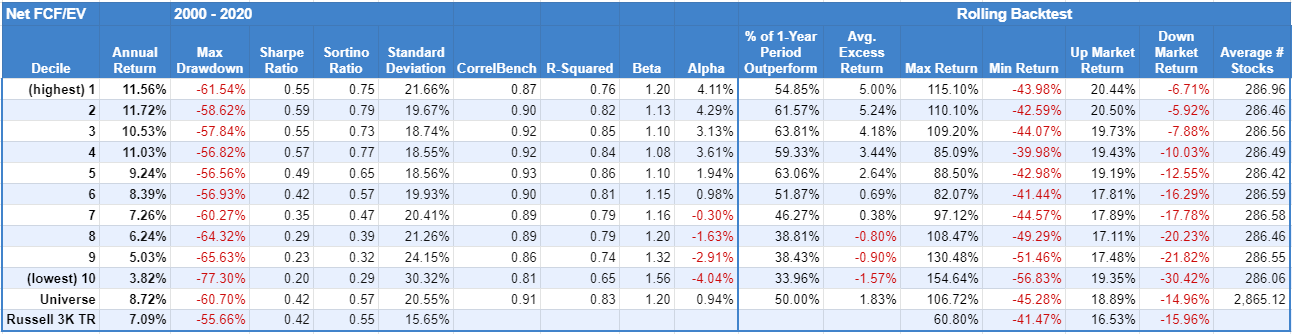
Net free cash flow accounts for dividends paid to shareholders. The difference between FCF/EV and Net FCF/EV is minimal.
Related Reading:
How Classic Value Metrics Performed this Century
How Cash Flow Based Value Metrics Performed this Century