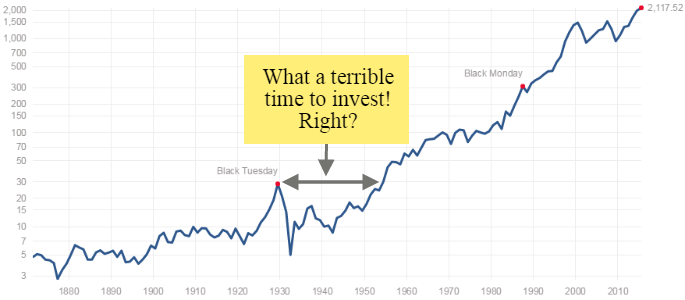
Show a chart of a bear market and I guarantee someone will say: The market went nowhere for years. What a terrible investment! Who would want to own stocks that long just to break even? How are you supposed to make money if it happens again?
Of course, it’s true. The market did go nowhere. Invested money went somewhere. An index, like the S&P 500, is not the same as investor returns.
To the untrained eye, the assumption is investors made no money during that time. I’m sure many investors didn’t. But some investors did. And neither’s returns looked anything like the chart.
The 1929 Peak and Recovery
The most cited case was following the ’29 crash. The stock market peaked in September 1929, then didn’t see that level again until 1954. That’s almost 25 years.
Looked at that way, stocks sucked. Except, they didn’t for the right investor. By right, I mean logical, rational, opportunistic, long-term investor.
The table below shows what investor returns would be during the same period (along with a few other bear markets when the market seemed to go nowhere).
The table assumes the investor bought the S&P 500 the month of the market peak, reinvested dividends, and waited for the market to get back to even.
| Market Returns vs. Investor Returns from Market Peak to Break Even | ||||
| Market Peak | Market Trough (Loss) | Time to Re-Peak | Market Returns | Investor Returns |
| Sept. ’29 | June ’32 (86.1%) | 299 months | 0% | 284.4% |
| Dec. ’61 | June ’62 (28.0%) | 20 months | 0% | 7.7% |
| Feb. ’66 | Oct. ’66 (22.2%) | 16 months | 0% | 2.2% |
| Nov. ’68 | May ’70 (36.1%) | 38 months | 0% | 11.9% |
| Jan. ’73 | Oct. ’74 (48.4%) | 89 months | 0% | 35.5% |
| Nov. ’80 | Aug. ’82 (27.8%) | 23 months | 0% | 16.5% |
| Aug. ’87 | Dec. ’87 (33.5%) | 22 months | 0% | 6.8% |
| Mar. ’00 | Oct. ’02 (49.1%) | 86 months | 0% | 26.0% |
| Oct. ’07 | Mar. ’09 (56.4%) | 64 months | 0% | 12.5% |
In each case the market peaked, fell at least 20%, and didn’t reach the previous peak again for months, sometimes years or decades (in the case of ’29).
An investor who bought the peak of 1929 would have grown their money 284% by the time the market broke even. That’s a far cry from what the chart seems to indicate.
The one thing that stands out – had someone invested at the peak and held tight, they always had more money when the market got back to even.
Why?
Because there’s a difference between price returns and total returns. Nobody bothers to account for dividends in charts.
Most charts only show price returns or the change in price over time. Investors get total returns from the change in price and dividends.
Total return is the only thing that matters.
Dividends drive investors to break even faster. Reinvesting those dividends into lower priced shares helps compound returns.
It’s absolutely possible that someone sold near the bottom, waited to get back in, and didn’t recover for years. But if the investor held on tight, they not only recovered faster but watched their money continue to compound while they waited for the index to break even.
For every investor scrambling to get out, there is another buying those shares. Maybe it’s the investor who stuck around – every share bought from reinvesting dividends, produced more dividends to reinvest along the way. Or maybe they even regularly added new money to buy up discounted shares – dollar cost averaging during bear markets compounds you’re already compounding returns.
You will experience a bear market or three in your lifetime. You’ll be tested each time. You can compound your short term losses by selling (and sticking yourself with a new question of when to get back in) or you can compound your long term gains by buying (and never worrying about when to get back in).
Regardless, your results will look very different from the S&P chart every time.