There are a lot of ways to fail at investing. Owning the worst-performing companies is a big one. The solution is a matter of avoidance. Is there a way to find the worst performers in advance?
Henrik Bessimbinder, while researching the greatest companies, looked at the worst-performing companies by decades. He broke the worst performers into two categories: by returns and total shareholder wealth lost.
The difference between the two categories is a matter of total dollars versus the percentage lost. A huge company can lose billions of dollars in shareholder wealth with a tiny percentage loss while a tiny company can have a huge percentage loss only losing millions.
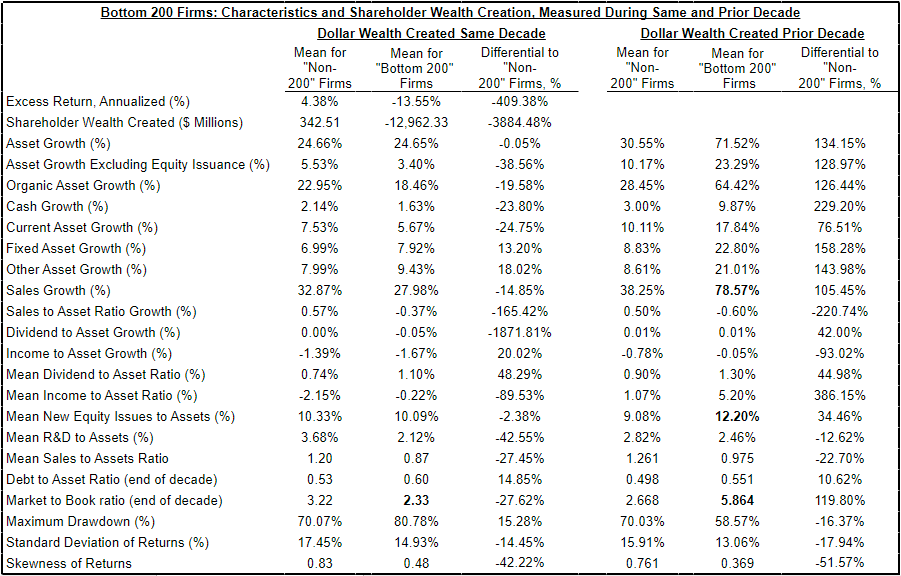
The top 200 companies in each category had a few characteristics that stood out during their worst-performing decade:
- The worst companies by return produced a -77% annual return, on average, losing about -$370 million in market cap per decade. These were small companies that got much smaller.
- The worst wealth creators produced a -13% annual return, on average, losing almost $13 billion in shareholder wealth per decade. These began the decade as mid to large-caps.
- Lower asset growth — many cases saw a reduction in assets.
- Reduction in cash — rising cash burn.
- Lower than average sales growth but still showing growth.
- Lower dividend yields and falling dividend payouts.
- Lower profitability and a reduction in income.
- Much higher than average increase in share count — serial stock issuers.
- Rising debt load by the end of the decade.
- Falling Price/Book ratio by the end of the decade.
- Worse drawdowns on average but also higher volatility for the smaller companies.
- The worst performers are more likely to be found in the tech sector than in any other sector.
It’s exactly what you expect to find in a company that performed poorly over 10 years. Slowing growth, falling profitability, declining dividend payouts, burning through cash faster than the business can replenish it, diluting shareholders with new share issuance, rising debt, and most important a high valuation that was cut by more than half in over a decade.
One big difference between the two categories stands out. The higher volatility in the smaller companies suggests that the market had a tougher time deciding on the companies ultimate demise. The stock had periods of high positive returns mixed into its worst-performing decade.
On the other hand, the worst wealth destroyers reads more like a mature profitable company that watched its competition slowly grind away at its market share. But that’s not necessarily the end of the story. Sometimes companies stumble. If management can fix the problem, it can reverse the trend. A company that trades at a low multiple, that then surprises on the upside, can produce outstanding returns.
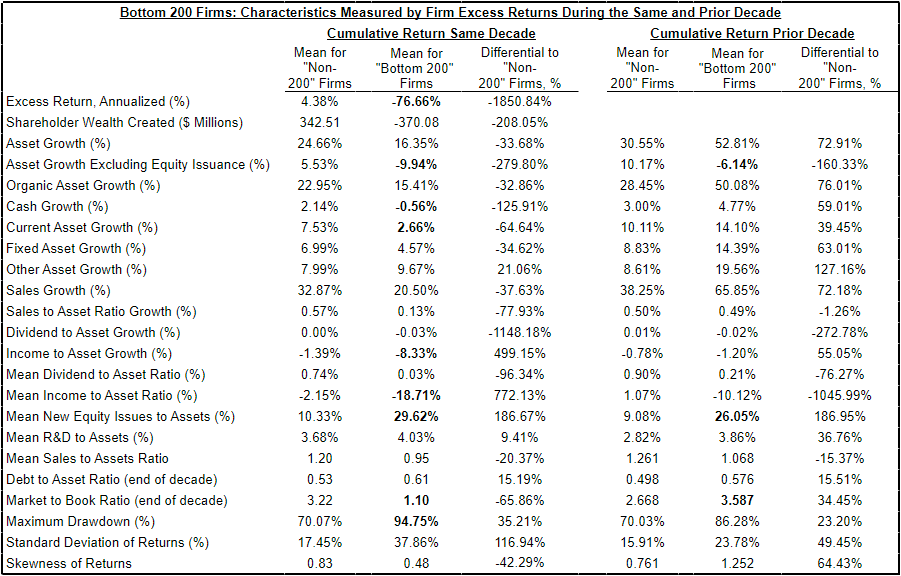
The real question is how do we avoid these losers in advance. Bessimbinder checked into that too. He looked at the decade prior to the worst decade and found a few helpful hints that stood out.
Higher leverage, falling income, high shareholder dilution, and a high valuation rounded out the significant metrics of the worst performers in the prior decade.
In terms of worst wealth destroyers, the companies were older, more profitable, and had high fixed asset growth in the prior decade. Which is not a sign of poor performance to come. But it does explain the two important pieces which stood out above the rest:
Perhaps most striking, firms with extreme negative shareholder wealth creation during a given decade have significantly higher market-to-book ratios at the end of the prior decade and are significantly more likely to have been included among the set of firms with “Top 200” shareholder returns during the prior decade. The last pair of results are suggestive that overvaluation during the prior decade may be a factor in determining the firms that suffer extreme shareholder wealth destruction during a given decade.
That a company’s worst decade likely followed its best decade is important. But the overvaluation only tells part of the story.
The market was enthusiastic about the “growth story.” So it paid a high multiple for that continued success. It just failed to anticipate the downside.
It’s not that high multiple stocks automatically perform poorly. It’s that something has to happen — mismanagement, stiffer competition, lower growth, etc. — to eventually make the market re-valuate the company in a big way.
So a company with a high multiple combined with increasing leverage, shareholder dilution, slowing growth, declining profits, and/or any other worsening metric listed above has a higher probability of horrible performance. Those are companies worth avoiding.
Source:
Extreme Stock Market Performers: Do Technology Stocks Dominate?
Extreme Stock Market Performers: What are their Observable Characteristics?
Extreme Stock Market Performers: Can Observable Characteristics Forecast Outcomes?
Related Reading:
Enduring Drawdowns in Wonderful Companies
What Makes Great Companies Great