The late 1920s market bubble was one of the biggest bubbles U.S. markets ever saw. Yet, not all industries participated in it. A breakdown of how each industry performed over that period tells the tale.
The Cowles Commission started collecting market data in 1932. The data is available online (linked below), stretches from 1871 to 1937, and is broken down by industry.
A chart of the 1929 bubble and burst looks like this:
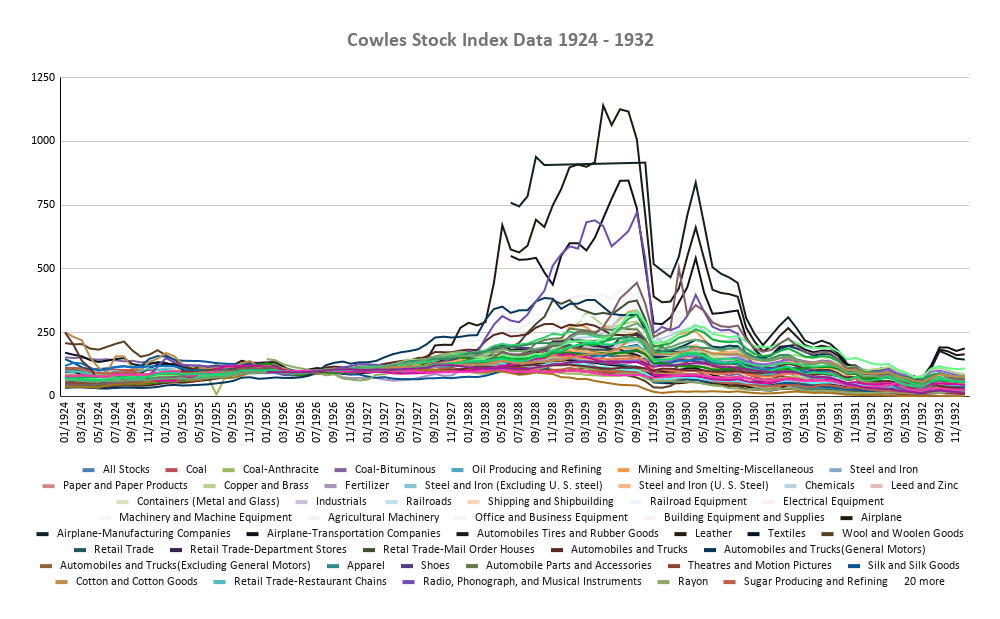
The data is price returns only — no dividends included.
The chart is a hot mess (done so on purpose). It’s also incomplete. For instance, the financial industry, along with investment trusts are missing from the picture. That said, it does show just how few industries were inflated at the time. Continue Reading…
 Buy the Book:
  Buy the Book:
  Buy the Book: