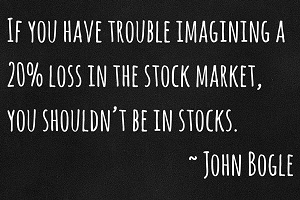
 No other asset class lives up to the long term returns of stocks. Despite that fact, most investors don’t stick it out long enough during the periods when stocks perform poorly and the big losing years tend to drive investors insane.
Of course, accepting that losses are inevitable helps to deal with the year to year results many investors obsess over. There are ways to invest, using different assets, that help make those stock losses more bearable. By combining two assets like stocks and bonds, you get a smoother ride over time because stocks and bonds don’t always move together.
Your allocation doesn’t need to be complex either. One of the most often cited allocations is a 60/40 Portfolio. It’s made up of 60% stocks and 40% bonds. How you choose to build each portion is up for debate.
In this example, I made it as simple as possible using the S&P 500 (w/ dividends) for stocks, 10 year Treasury Bonds for bonds, and the 60/40 Portfolio is the respective mix of the two, rebalanced annually, based on returns from 1928 to 2014. It’s not the best allocation, or the worst, but it does a good job of showing what happens when you combine different assets.
| Annual Returns | ||
| Stocks | Bonds | 60/40 Portfolio |
| 9.82% | 5.00% | 8.46% |
Had you put all your money into stocks back in ’28, and stuck with it through all the losing years (despite the temptation to sell), you would have seen a 9.8% annual return. If instead you played it a little safe, putting 40% of your money into bonds, you earned 8.5% annually, or 1.36% less than stocks.
If you only based your decision on past returns, stocks would be the easy choice, but you’d never get the full story.
| Years w/ Gains | ||||
| Stocks | Bonds | 60/40 Portfolio | ||
| # Years w/ Gain | 63 | 71 | 68 | |
| Avg. Rtns | 21.45% | 7.38% | 14.01% | |
| Median Rtns | 20.34% | 4.47% | 12.70% | |
| Best | 53.99% | 32.81% | 33.14% | |
| Worst | 0.47% | 0.38% | 0.33% | |
Focusing on the gains doesn’t help the argument either. If stocks only went up, there’d be no reason to own bonds ever. But they don’t, which is why we diversify.
| Years w/ Losses | ||||
| Stocks | Bonds | 60/40 Portfolio | ||
| # Years w/ Loss | 24 | 16 | 19 | |
| Avg. Rtns | -13.61% | -4.07% | -8.11% | |
| Median Rtns | -9.44% | -2.61% | -4.91% | |
| Best | -0.41% | -0.30% | -1.14% | |
| Worst | -43.34% | -11.12% | -27.03% | |
Looking back at the annual returns, the 1.36% difference between stocks and the 60/40 Portfolio may not seem like much, but it adds up to a lot after several decades. It only adds up, if you never sell. You had to deal with 24 losing years with eleven losing years worse than -10%, six years worse than -20%, and three years were worse than -30%. Are you sure you never would have sold?
On the other hand, a simple 60/40 Portfolio gave up a little bit of return to protect yourself from bigger losses. You still had to deal with 19 losing years, but the losses were very different – only five years with losses worse than -10% and two years were worse than -20%. Owning some bonds may have lowered your overall return by a little bit but drastically helped when stocks fell.
You need to decide whats more important: not missing out on the higher stock gains or protecting your money and yourself from the bigger stock losses. Investors bounce between the greed and fear in those two choices all the time. Here’s a better question. What are you more comfortable with: a 30% loss or missing out on an extra 1.36% annual return?
Thankfully, those aren’t your only two choices. There are alternative allocations – using international stocks, emerging markets, REITs, and other asset classes, factor tilts and smart beta, and tactical strategies – that can make up some of the difference in returns and offer better protection from losses.
If you can handle big losses then all this was moot. Most people can’t, or forget they can’t until it happens again. How well you handle losses, along with your financial goals, will ultimately determine your allocation. For now, the simple 60/40 Portfolio of stocks and bonds gives you an idea of what to expect.